SOCIS 2019: Orbit Determination with SatNOGS

I made the modifications to the program and got the following log:
orbit-determination-generated-log.out (424.8 KB)

Looking at the graphical representation of how some of these parameter change over the OD we get:

Which zoomed in look like:

It seems to be slowly spiralling in on an optimal value, but never quite converging. I’m unsure what could be causing this. I could try adjusting the initial stepsize and seeing if that is causing the Levenberg-Marquardt to head towards the wrong solution (eventhough it would surely still converge fairly quickly)?

When using the Gauss-Newton optimizer and drag.cd.estimated = true the OD failed within two iterations with the hyperbolic orbit error.
When attempting it with drag.cd.estimated = false it fails after the first iteration with a convergence failed error.

The process is erratic right from the beginning. The position changes shown by ΔP are tens of thousands kilometers from one iteration to the other, just as if the satellite was put at some random place about the Earth at each iteration. The OD just lost its marbles.

We seem to have a big observability problem with these measurements here. Perhaps we try to estimate to much parameters that have inter-dependencies (perhaps drag coefficient and Doppler bias) ? At least, the initial step factor is probably way too high as the ΔP skyrockets right from the beginning.

I was wondering if we simply can observe drag with only Doppler data. Perhaps it is not possible. In order to check this, we would need to look at the a posteriori covariance (which can be extracted from the optimum result, but it is quite convoluted). Also this can be done only once we have at least convergence. Perhaps we could look at this on one of the data sets that work (perhaps even the original one with real measurements from 39-CGBSAT-VHF).

@cgbsat, do the SatNOGS antenna use autotrack for their pointing or do they only point towards an ephemeris or TLE provided line-of-sight? If they have autotrack, perhaps we could add even very crude angular measurements to the Doppler shift, even with very large standard deviation, just to prevent the process to diverge.

It seem so, adding in multiple data sets improves things (at least a little bit) and I have managed to achieve convergence when using generated data from a few different combinations of multiple stations (although some combinations fail with a convergence failed error.)
I have also managed to achieve convergence using the real measurements from 39-CGBSAT-VHF.

This file contains the log for the real measurements:
orbit-determination-convergencesuccessful-realmeas-log.out (70.4 KB)

Log for the generated measurements:
orbit-determination-convergencesuccessfulmutli-generated-log.out (121.6 KB)

How would I best go about extracting the a posteiriori covariance?

Good news, it is less convoluted than I thought. In fact, we already provide a dedicated method for that: getPhysicalCovariances in BatchLSEstimator. The threshold parameter is not critical, it is just there to detect singularities, so put any small value as you want.

What you will get from this method is the full covariance matrix, already scaled according to the physical parameters (because the optimizer does solve a normalized problem, this is why I said it was convoluted because of the required descaling; in fact this is already done by this method). The elements of the square covariance matrix are sorted with orbital parameters first, then propagator parameters, then measurements parameters. So you can get the corresponding parameters names using the getOrbitalParametersDrivers, getPropagatorParametersDrivers and getMeasurementsParametersDrivers and do some counting and checking of names in order to find the parameter you need. Suppose for example that you find the drag coefficient is at index iDrag, then FastMath.sqrt(covariance.getEntry(iDrag, iDrag)) will be the standard deviation of the estimated drag. IF this value is very high (which I expect), then it means the uncertainty of the estimated parameter is high, or in other words this parameter is difficult to estimate. This of course depends on the measurements set: better measurements, or better spreading over the orbits, or longer observation range are some of the many factors that will affect this covariance. It would be nice adding to the final log, when we print the line with parameter change and final value, to also print the standard deviation of the corresponding parameter so we have a hint that OD was good or failed miserably.

Another thing that might be interesting to extract (but not for all parameters, as we would be overwhelmed and it would in fact correspond to printing the full matrix itself), is to see if some parameters have a strong correlation. If for example you want to look at the correlation between estimated drag and estimated Doppler bias, you could do it using the following snippet:

 sigmaDrag                  = FastMath.sqrt(covariance.getEntry(iDrag, iDrag));
 sigmaDoplerBias            = FastMath.sqrt(covariance.getEntry(iDopplerBias, iDopplerBias));
 dragDopplerBiasCorrelation = covariance.getEntry(iDrag, iDopplerBias) /
                              (sigmaDrag * sigmaDoplerBias);

Correlations are numbers between -1 and +1, with extreme values showing higher correlation and values close to 0 showing no dependency between parameters. If we see a high correlation between two estimated parameters, this means it is difficult to tell them apart: they have inter-dependencies and cannot reliably be observed with this measurements set.

The process converged, but the orbit is not good. The position is -82401647.650, -91786008.130, -57575863.761, so its norm is about 136000km. The satellite is a LEO, it should be about 7000km for Earth center, not 136000km.

Correct, I’m unsure what is going wrong here as it was successful when commenting out drag.cd.min and drag.cd.max in the config file, (which I had managed to mix up in my head with the one that used them.) Curiously it hadn’t even capped out at the max value when these flags were in use.

Hi @noeljanes,

Are you sure you’re not having a unit issue somewhere, like a km to m conversion that is done wrong ?
Your measurements are about unit size (from -2.5 to +3. in a random file I opened) but the residuals are thousands sized… it does seem fishy to me.
Sorry to just barge in the conversation, maybe I’m completely off topic… but just to be sure.

Maxime

The majority of the SatNOGS stations use omni-directional antennas, so the antennas are not actively pointing to track a satellite. Some stations use directional antennas (yagi’s etc), which are actively steered to follow the predictions from a TLE. However, this is completely passive, so there is no angle information available.

I will try again to get some more stations to track on VHF.

Hi

I’ve just had a look, and the units seem correct as far as I can see. The measurement files are all given with a range-rate in km/s which is then parsed by the OD program to give it in m/s.
By residuals you are talking about the RMS values correct?

All help is appreciated, and it could well be something that simple

No I meant the final residuals of the measurements when you’re printing their mean/max/sigma. But it’s ok if one is in km and the last in meters then it should not be a conversion issue.

Still, I’m really surprised that you’d get such an orbit change, especially with simulated measurements, I can’t tell for the real measurements from SatNOGS.

On this particular log you gave altitude starts at ~500km and ends up at ~10000km.
This is quite off the chart…

What is weird is that when I read the whole thread of comments it seems you had a measurement generation and OD working well in the first posts. I can’t see what happened in the meantime and, to be frank, I don’t have time right now to read it all :sweat_smile:

Maybe, if you’re stuck and haven’t done this yet, you should try the following to validate your OD scheme:

  • Generate the measurements with 1 or 2 stations for 1 or 2 orbital periods; with no noise and no biases;
  • Run an OD with these measurements and a perfect start (ie. the same you used for the generation) and a stations’ sigma of 1m/s (you cannot put 0m/s the OD will crash; and with 1m/s the RMS will directly show the unweighted cost function of the least squares).
  • Estimate only the orbit to keep it simple;
  • With the debugger check the values of the estimated measurements on the 0th iteration. They should be exactly the same that what the simulated measurements you have in your measurements’ file.
    That way you will see if there is a bug or discrepancies in your OD scheme.
    With the same configuration, run the OD (ie. stop the debugger) and see if it converges to the initial orbit values.
    This should work, basically this is exactly what is done in Orekit tests, see BatchLSEstimatorTest.testKeplerRangeRate.

When this works, then you can start adding up some uncertainties.
I would add them up one by one (not sure about the order):

  • Measurement noise of different values, check if your final sigma is about what you’ve given in input; your mean value should be 0 and your max residual about 3sigma;
  • Biases in stations, check that they are properly estimated;
  • Add a bias to the initial orbit and check that the orbit converges properly towards the orbit you used to generate the measurements. See how much you can displace the initial orbit before the OD goes nuts;
  • Estimate the drag coefficient, without and with a bias on the initial value.

With this I think you should be able to rule out any error and see where the estimation process fails.

Hope this helps,
Maxime

1 Like

I got a “matrix is singular” error when using
final RealMatrix covariance = estimator.getPhysicalCovariances(1);
on line 576 (so after the optimum result has been determined.) Is this something I have done incorrectly (i.e. placed it in the wrong location) or is this an issue with the optimum result?
The log file is the following:
orbit-determination-generated-log.out (104.4 KB)
And the config file is:
maxvalier.in (31.1 KB)

Just to give a quick recap, the OD seemed to work reasonably well until I set the drag.cd.estimated flag to be true (it was set to false for the initial ODs that worked.) This seems to then cause the OD to estimate massive coefficients of drag (orders of magnitude larger than expected,) or just failing outright with a variety of errors. In an attempt to limit this we introduced a drag.cd.max and drag.cd.min, but this seems to come with the drawback of driving the OD to an incorrect estimate.

Thank you very much for the advice, I’ll start working through the recommendations tomorrow.

I have worked my way through this advice.
The OD runs successfully and generates a decent estimate for position (to within couple of hundred meters, I’m going to see if I can improve this by tweaking certain parameters such as estimator.Levenberg.Marquardt.initial.step.bound.factor) as long as I don’t try and estimate the drag coefficient.
This applies to measurements generated with:

  • Perfect conditions (no noise or bias)
  • Measurements generated with noise (but no bias)
  • Measurements generated with both noise and bias

The OD even managed to recover the correct sigma used in the generation if the station’s sigma was set to 1 in the config file. This also applies to the station bias, which were successfully estimated.

When estimating the drag coefficient the OD breaks down and incorrectly estimates the sigma by several orders of magnitude (~4800m/s rather than 15m/s) and also adjusts the bias to incorrect values (sometimes over 400m/s and sometimes all the way down to 0m/s compared to the 375m/s used in generation.)

@luc how does Orekit estimate the drag coefficient?

Hi Noel,

So it seems I made you do some extra work for nothing since you already had that result. Sorry about that…

I think “1” is a much too high value. I tried with 1e-15 in your code and the singular matrix exception disappeared.

Could you please send us a measurement file and a maxvalier.in file with no noise and no bias that would come from your tests ?
So we can investigate the drag issue in a “clean” environment. I tried to run the debugger on the batch least-square scheme but it is quite hard to sort out issues since there are errors and biases on the measurements.

If the drag coefficient is not observable, which is what Luc and you suspect, it should be directly visible in the Jacobian matrix of the LS problem.

Maxime

No worries, it did make sure to rule out any other possibilities as it reminded me to go through the possibilities methodically.

Thank you very much, I just tried it with that and it worked. I’ll have look through the matrix in a bit.

I have attached two measurement files with no noise and no bias as well as their corresponding Maxvalier.in file.

generated-doppler-39-CGBSAT-VHFnonoise.dat (43.9 KB) generated-doppler-Kir-virtnonoise.dat (75.3 KB) maxvalier.in (15.5 KB)

Hi Noel,

I think there is some noise of 1m/s sigma no ? Because the residuals show a 1m/s final standard deviation when I run the OD on it. Anyway the errors are so large that it is not a problem.

So… I found a bug in your code :wink:
It’s actually a small typo… that has dire consequences.
It is where you set up the min/max of the drag coefficient.
You wrote:

if (cdEstimated) {
        for (final ParameterDriver driver : propagatorBuilder.getPropagationParametersDrivers().getDrivers()) {
          if (driver.getName().equals(DragSensitive.DRAG_COEFFICIENT)) {
            driver.setSelected(true);
          }
          if (parser.containsKey(ParameterKey.DRAG_CD_MIN)) {
            driver.setMinValue(parser.getDouble(ParameterKey.DRAG_CD_MIN));
          }

          if (parser.containsKey(ParameterKey.DRAG_CD_MAX)) {
            driver.setMaxValue(parser.getDouble(ParameterKey.DRAG_CD_MAX));
          }
        }
      }

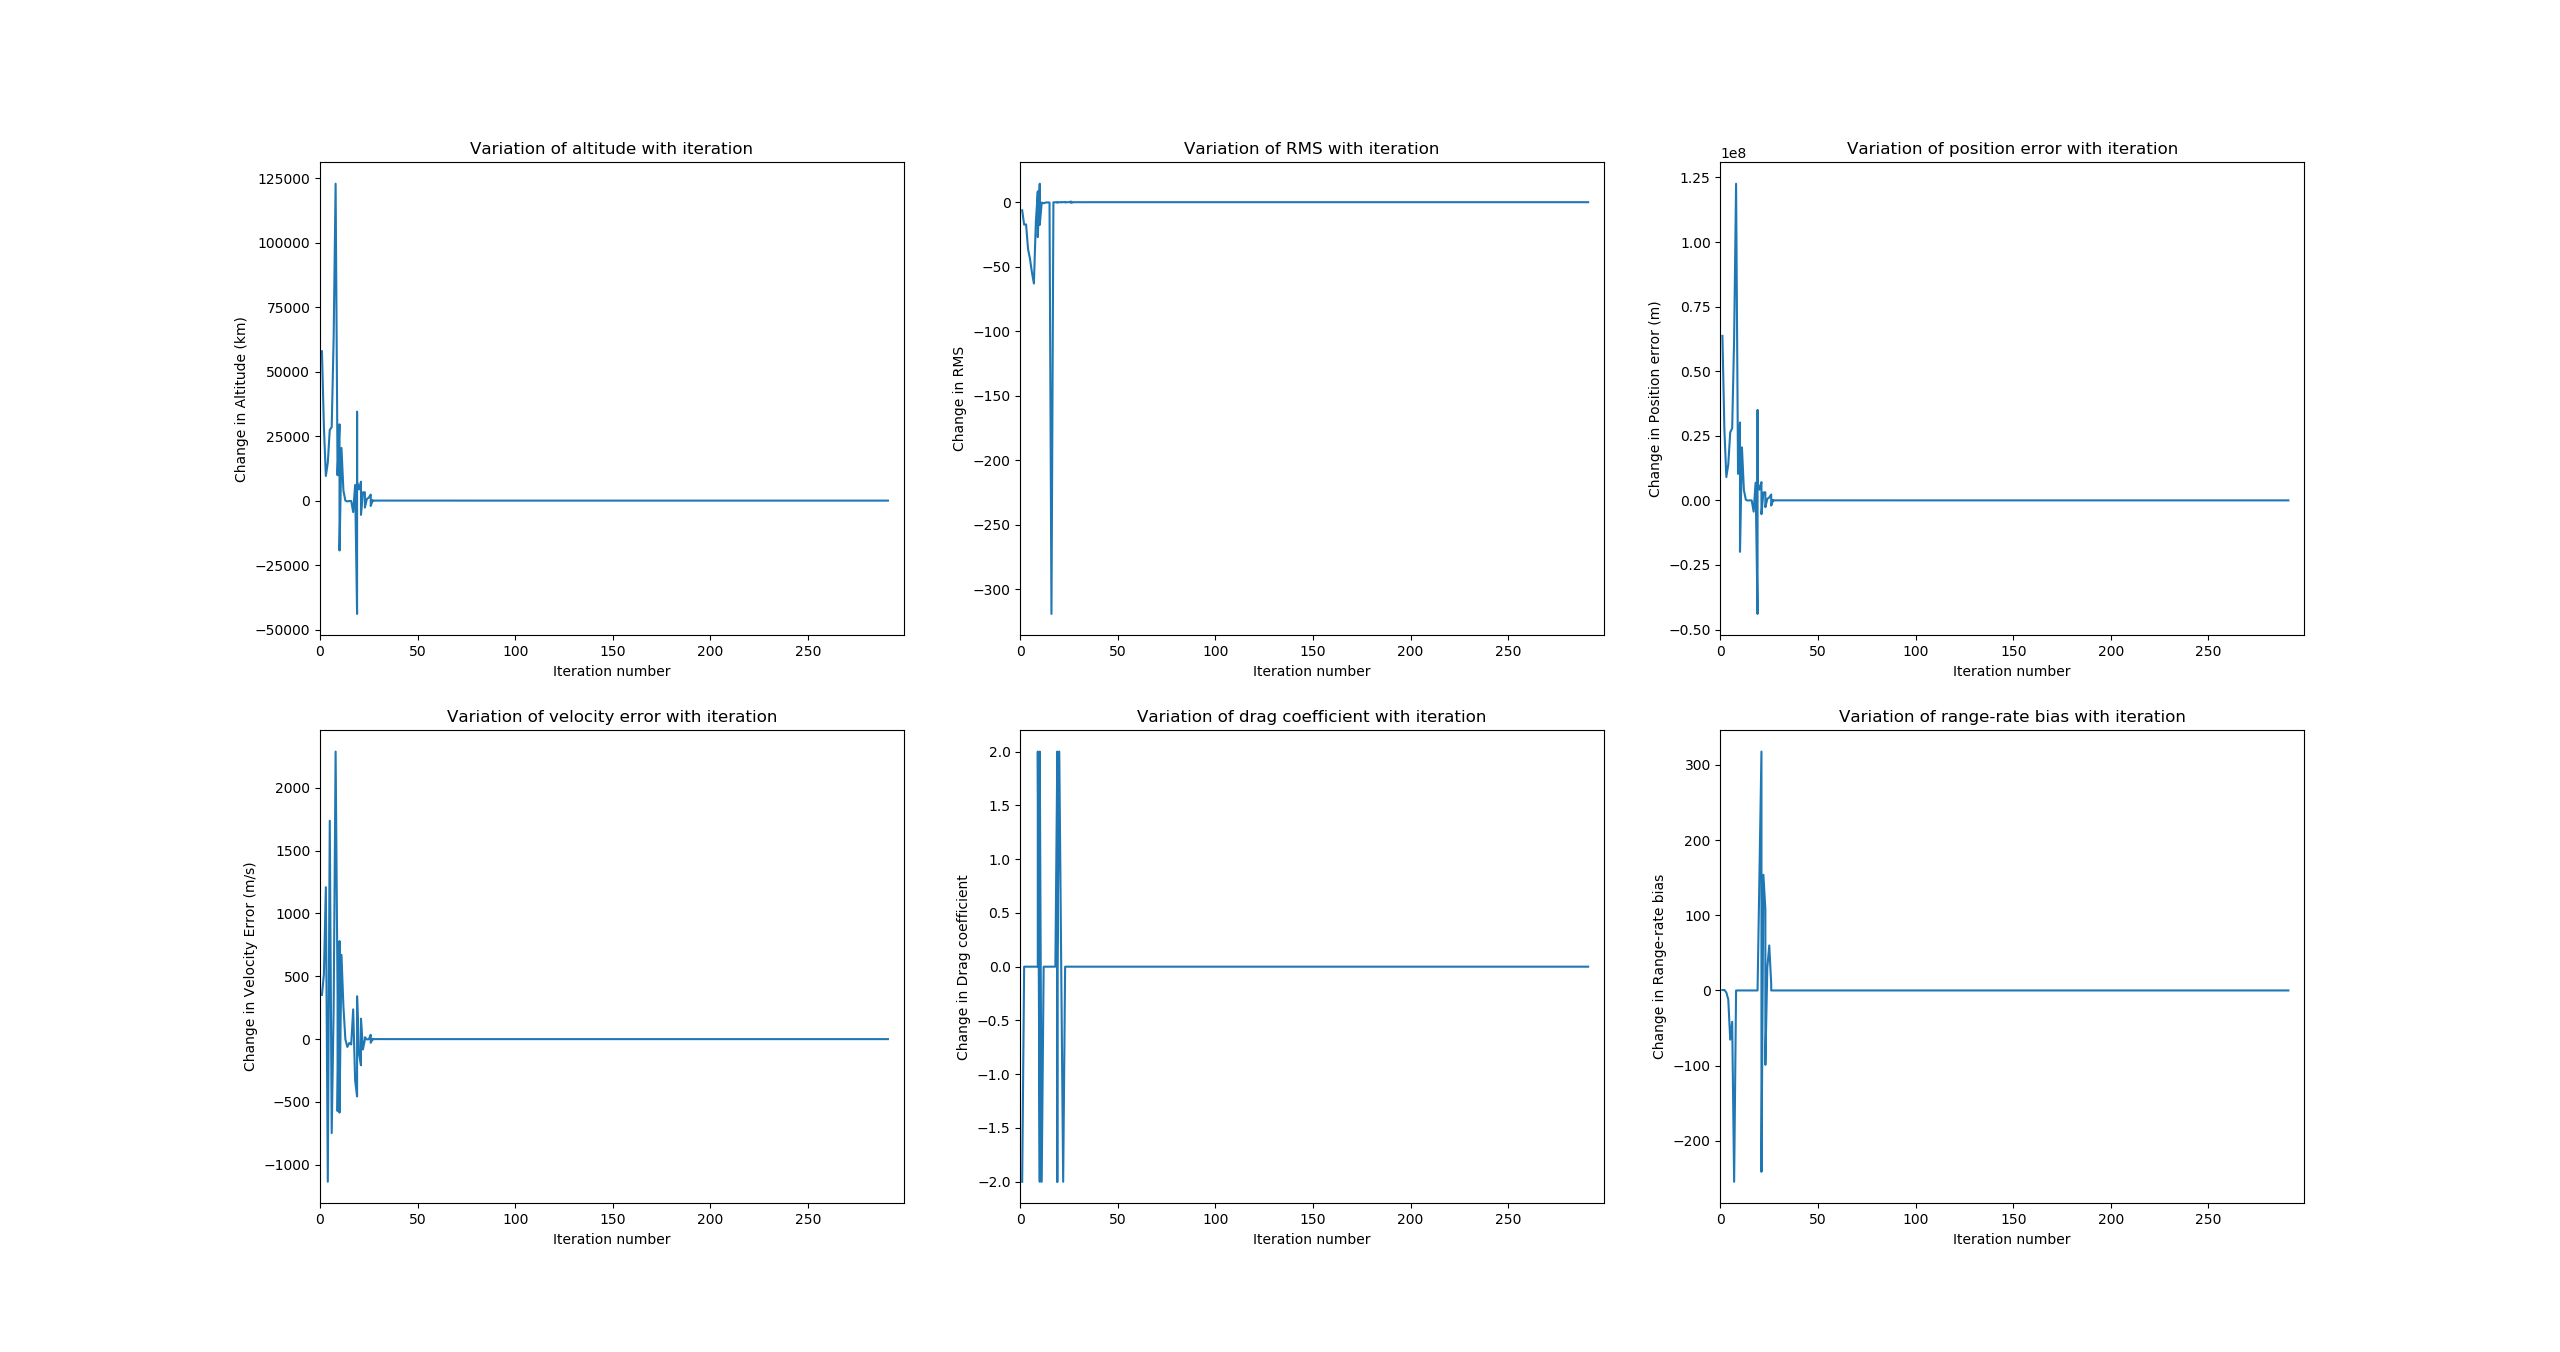
What’s happening here is that you’re looping on ALL the propagation drivers (even those that are not selected for estimation) and setting their min/max to respectively 0/20 in the case you sent me.
The drag coefficient is happy with that, but the gravity coefficients of the Earth, Sun and Moon… not really.
When you set µ(Earth) = GM(earth) max to 20, it automatically checks that its current value is not higher than that. Since its current value is around 3.986e14, it is set to 20.
So the Earth mass and gravity are divided by about 2e13, it is quite a dramatic loss of weight :sweat_smile:
By then your orbit and OD are completely off the chart. And it explains the weird results you’ve been getting since 2 weeks.

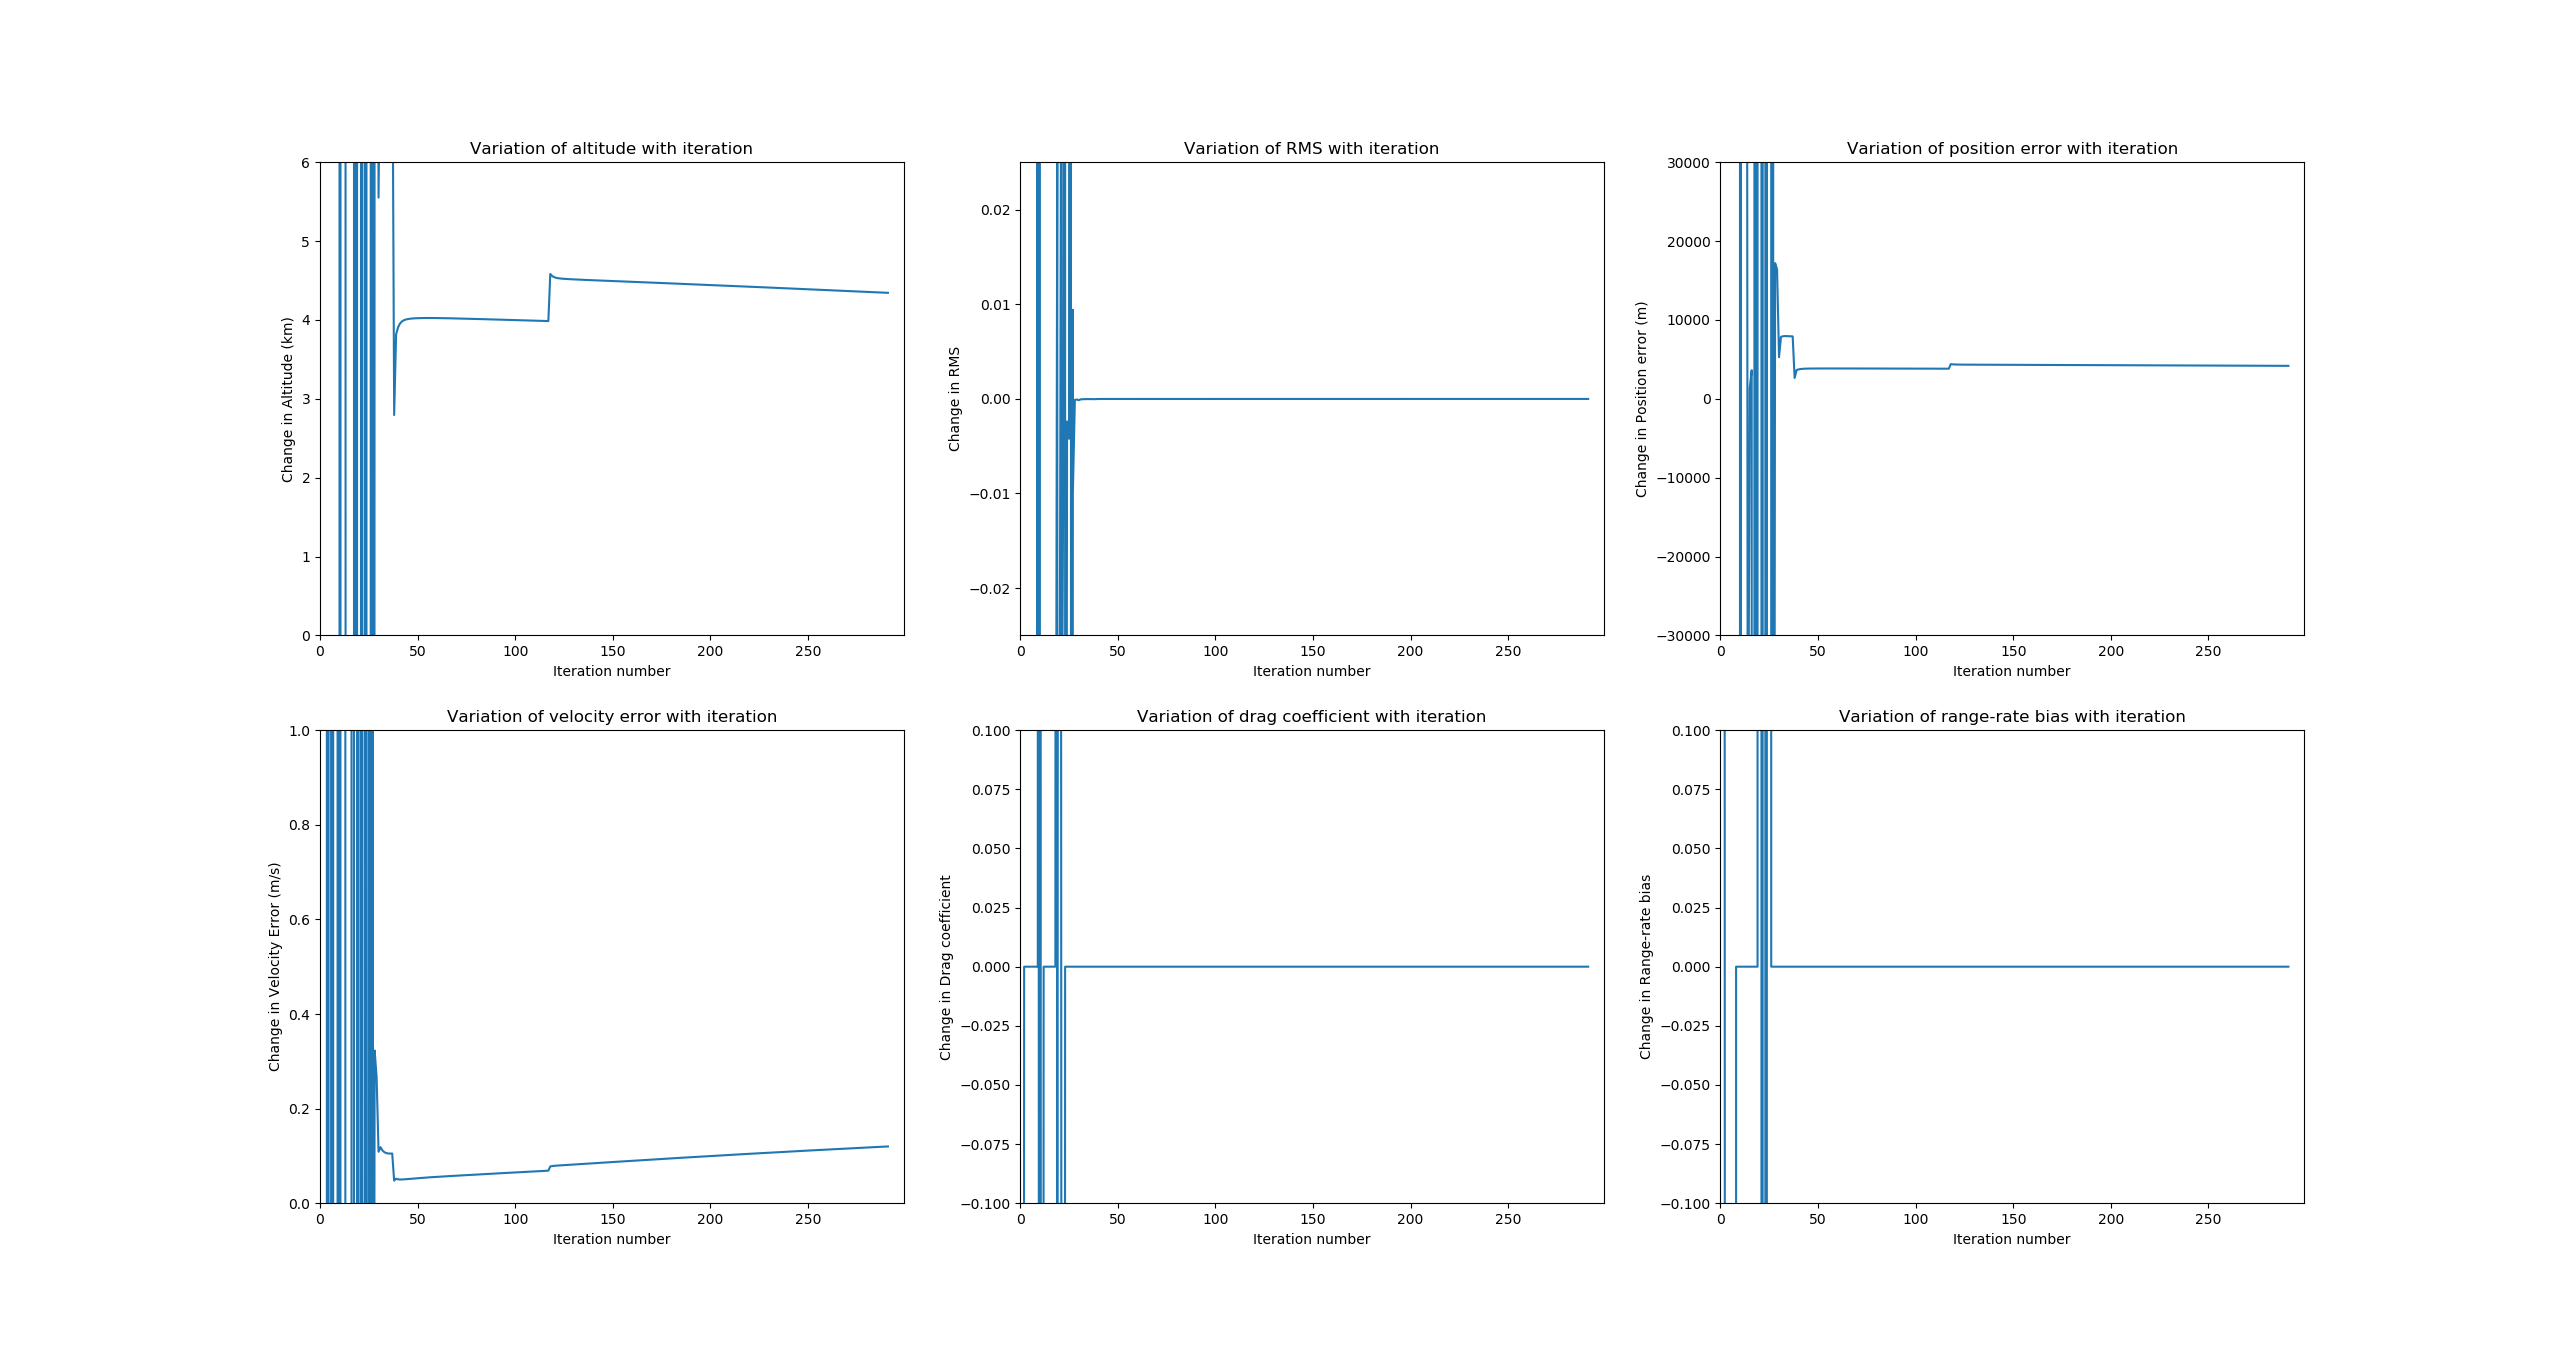
So what you need to do is incorporate the part:

          if (parser.containsKey(ParameterKey.DRAG_CD_MIN)) {
            driver.setMinValue(parser.getDouble(ParameterKey.DRAG_CD_MIN));
          }

          if (parser.containsKey(ParameterKey.DRAG_CD_MAX)) {
            driver.setMaxValue(parser.getDouble(ParameterKey.DRAG_CD_MAX));
          }

Into the loop

          if (driver.getName().equals(DragSensitive.DRAG_COEFFICIENT)) {
            driver.setSelected(true);
          }

With that I get the following final iteration

Iteration Number:   4,     Evaluations performed:   5,  Altitude (km): 474.9533425428784,     ΔP(m):      0.000514,   ΔV(m/s):  0.000000158,   RMS:   1.089395345571,      nb Range-rate: 2042/2042 
 The estimated Cartesian parameters:  {2019-06-11T16:35:29.149, P(-5253153.081935317, -4400321.643770282, 79996.07599597143), V(-559.0399478765471, 763.992472405819, 7585.013897366148), A(6.505766337336994, 5.4495774208334, -0.09907112361208954)} 
 Position separation (m) 92.80720297547316,    Velocity separation (m/s) 0.042960846134871646
Estimated orbital parameters changes: 
   1 Px                +40.918064682744  (final value:  -5253153.081935317000)
   2 Py                -26.643770282157  (final value:  -4400321.643770282000)
   3 Pz                -78.924004028566  (final value:   79996.075995971430)
   4 Vx                -0.039947876547  (final value:  -559.039947876547)
   5 Vy                -0.007527594181  (final value:   763.992472405819)
   6 Vz                +0.013897366148  (final value:   7585.013897366148)
Estimated propagator parameters changes: 
   1 drag coefficient  -0.499086423900  (final value:   1.500913576100)
Estimated measurements parameters changes: 
Estimated orbit: Cartesian parameters: {2019-06-11T16:35:29.149, P(-5253153.081935317, -4400321.643770282, 79996.07599597143), V(-559.0399478765471, 763.992472405819, 7585.013897366148), A(6.505766337336994, 5.4495774208334, -0.09907112361208954)}
Estimated orbital parameters changes: 
   1 Px                +40.918064682744  (final value:  -5253153.081935317000)
   2 Py                -26.643770282157  (final value:  -4400321.643770282000)
   3 Pz                -78.924004028566  (final value:   79996.075995971430)
   4 Vx                -0.039947876547  (final value:  -559.039947876547)
   5 Vy                -0.007527594181  (final value:   763.992472405819)
   6 Vz                +0.013897366148  (final value:   7585.013897366148)
Estimated propagator parameters changes: 
   1 drag coefficient  -0.499086423900  (final value:   1.500913576100)
Estimated measurements parameters changes: 
Number of iterations: 4
Number of evaluations: 5
Measurements type: range-rate
   number of measurements: 2042
   residuals min  value  : -3.8618207602457915
   residuals max  value  : 3.2141390786164266
   residuals mean value  : -0.027685765570733413
   residuals σ           : 1.0893102463210969
[Px = -5253153.081935317, Py = -4400321.643770282, Pz = 79996.07599597143, Vx = -559.0399478765471, Vy = 763.992472405819, Vz = 7585.013897366148]
[drag coefficient = 1.5009135761004808]
[]
Covariances:
	27.752537426374765
	29.591865288539864
	41.23772020764571
	0.033527693705399306
	0.03219533856498905
	0.02079745262867609
	0.8839836987491664
wall clock run time (s): 45.407000000000004

Which is much more realistic.

However the drag coefficient is off by -0.5 (25% of its “real” value), which is not very good.
The standard deviation (σ) of the drag coefficient is 0.88 (last value of the covariances column) which means that it is hardly observable since its σ is of the same order of magnitude than its value.
You can improve that a little with more measurements and a longer orbital arc…
But you already have quite a number of measurements on a 14h arc. I suspect range rate measurements are not the best to estimate the drag coefficient.
This is something you should probably analyse after you’ve fixed the bug.

Cheers,
Maxime

I used a sigma of 1m/s as the measurements generation program requires a non-zero station sigma or it will crash (in the same way as the OD program does.)
Sorry that I forgot to mention this :sweat_smile:

Thanks for the correction on the bug, I’ve just implemented the changes you suggested and got the following log for a measurement with noise and bias:
orbit-determination-log.out (69.5 KB) orbit-determination-range-rate-residuals.out (275.4 KB)

The most important factors are the following calculated standard deviations:
Standard deviation of the estimated drag: 11.389887192843828 (cd= 15)
Standard deviation of the range rate bias: 0.6698204142396694 (range rate bias = 375)
Correlation of drag and doppler bias: -0.09756404007878325

@luc I’ll have a look at the correlation between the various parameters over the next week or so when I have some time. @cgbsat also sent me 28 new doppler curves that I can work on as well. I’ll try to keep you updated as and when I can (internet connection allowing as I’ll be travelling :sweat_smile:)

That’s weird. We should probably fix that. We should be able to generate “perfect” measurements for validation purposes. But that’s not urgent.

I’m not sure I understand everything in that log:
It starts off with a “position/velocity separation” of about 60km and 45m/s. Is that the initial orbital bias with respect to the reference orbit (the one you sue to generate the measurements) ?
There’s a lot of iterations. Maybe you could try to increase the estimator.normalized.parameters.convergence.threshold value to 1e-2 or even more and see if you can have a faster OD without a big loss of accuracy.

I read Cd = 0 at the end, did I miss something ?
If not, can you check that the drag was activated when you generated the measurements ? Just to be sure :wink:
σ(Cd) ~ 11.4 is huge, no wonder it has a hard time estimating the drag coefficient.
Range rate biases estimations are pretty good.

That is correct, I used a set of measurements that were generated with a bias (375m/s) and signal noise (15m/s) and then used a different position in the config file than in the generation to test if it converged as desired (which it did, apart from the estimated cd.)
I’ll rerun it with the convergence threshold set to a larger value and see if that has any impact on the resulting prediction.

It did head to 0 (after initially sitting at 20 for a couple of iterations) for some reason.
I’ll regenerate the measurements and make sure that they do contain a drag coefficient (as one can never be too sure :smile:.)

It’s a huge σ(Cd) so it does seem to be having difficulty estimating the drag coefficient, which suggests that the range-rate measurements aren’t the best to use to estimate the drag coefficient (as we already suspected.)

It seems to estimate the σ(noise) and the range-rate biases well.

Indeed. You can try to lengthen your orbital arc to see if it improves the estimation of Cd.
Maybe something like: perfect (or almost) measurements, no bias estimation, no initial shift in orbit and an increased convergence threshold. All this to make your OD faster and rule out other error sources.
Try with 1 day, 2 days etc… and see if the drag coefficient estimation improves and how much its σ drops. You can also print the whole matrix line of correlation factors related to Cd to see how it changes with a longer arc.
Then incorporate gradual levels of noise and see how it affects the σ again.

It’s just an idea to study that particular point.
If you’ve got some better things to do… do it :wink:
I don’t want to add more noise to the conversation.