I decided to use 7 different stations to look at the influence of these factors. The idea behind this was to confirm that the trends carried over between stations and weren’t as a result of other factors (for example potential errors due to low elevation above the horizon and such.)
The stations used were:
- 39-CGBSAT-VHF (52.834°, 6.379°, altitude 10m)
- ZL1WJQ (-37.188°, 174.875°, altitude 65m)
- F4KLD-UNIVERSITE-PAUL-SABATIER-Toulouse-III (43.562°, 1.469°, altitude 180m)
- Apomahon (38.048°, 23.739°, altitude 119m)
- Marcs (48.644°, 2.231°, altitude 110m)
- GU-virt (55.861°, -4.251°, altitude 49m)
- Kir-virt (67.840°, 20.409°, altitude 401m)
All bar the stations with the -virt suffix are part of the SatNOGS network, whereas I created the other two to simulate measurements from a wider range of latitudes and longitudes.
Changing Standard Deviation of noise in the measurement generation
I changed the standard deviation of the noise in both the measurement generation and the maxvalier.in files.
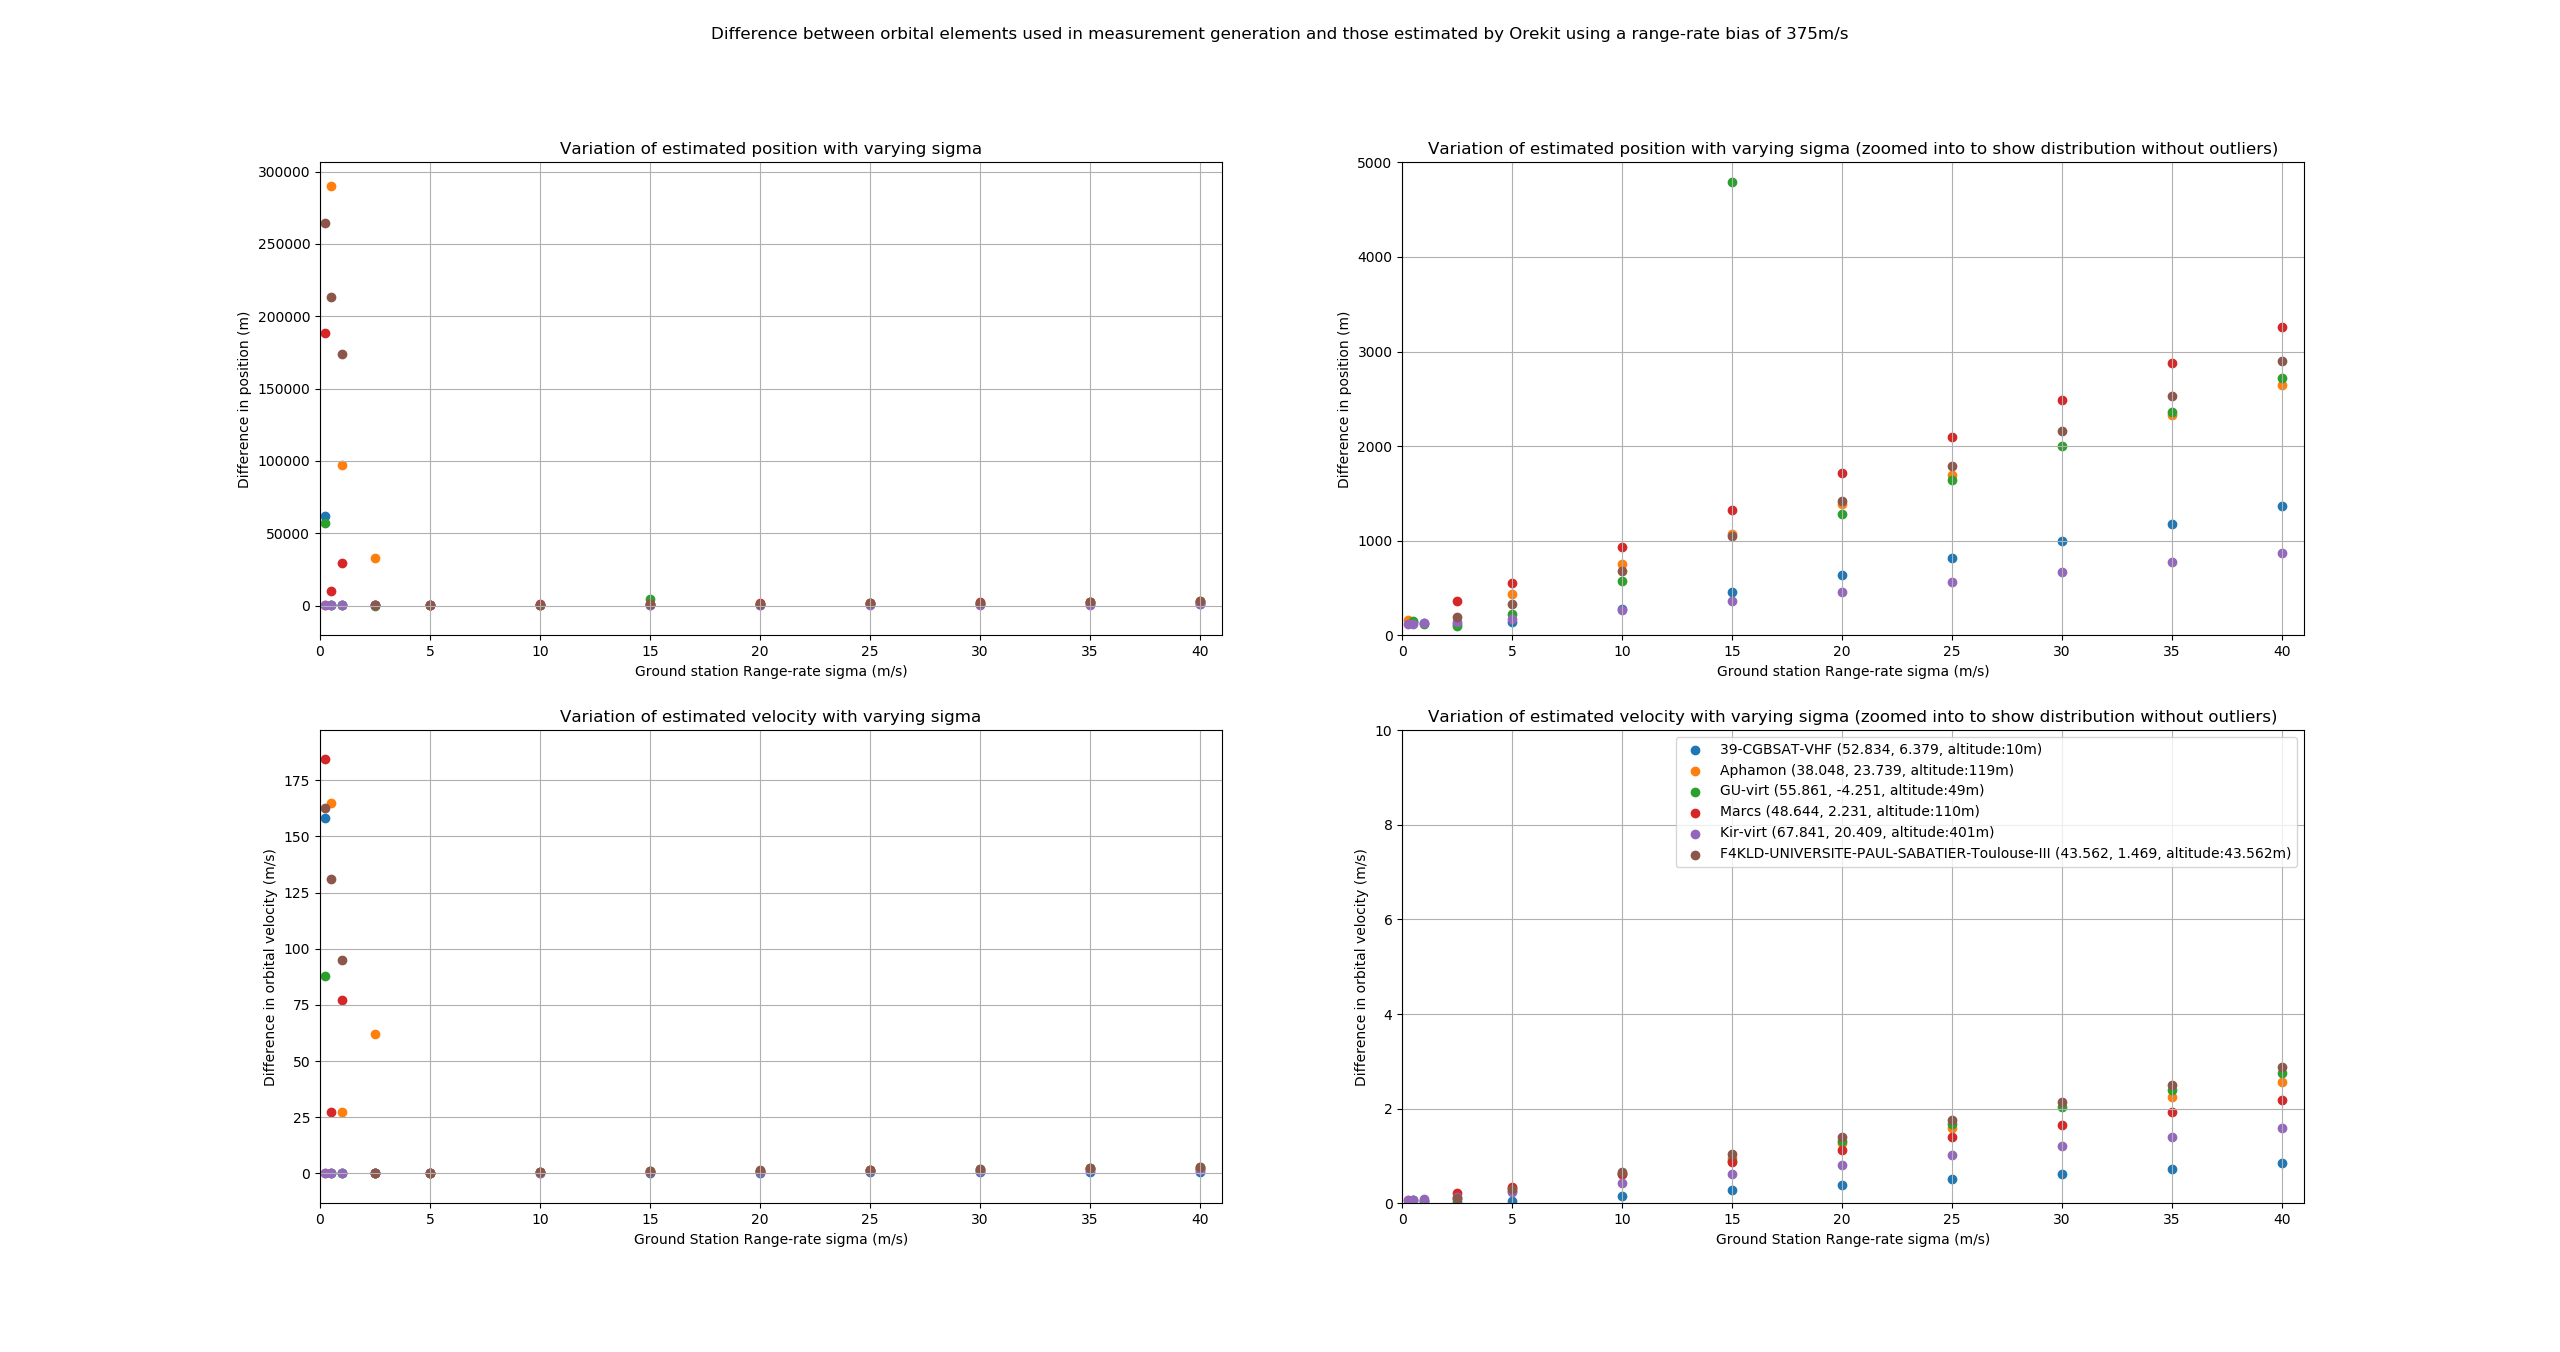
I noticed a general trend of a smaller difference between the estimated Cartesian parameters and those used in the measurement generation as the standard deviation decreased (difference in position is in the top row, and velocity is in the bottom row):
In general the various stations followed a similar trend with smaller Δ’s for smaller standard deviations, but the estimated position and velocity would sometimes shoot off to a much larger value (most noticeably at really small values of σ.)
I’m unsure why the OD sometimes converges on an incorrect result and sometimes doesn’t (are there much higher orbits that give a similar radial velocity to those in LEO?)
A sigma of 5m/s seems to be the best compromise between accuracy in the estimated parameters and reproducibility between stations.
Multiple Stations
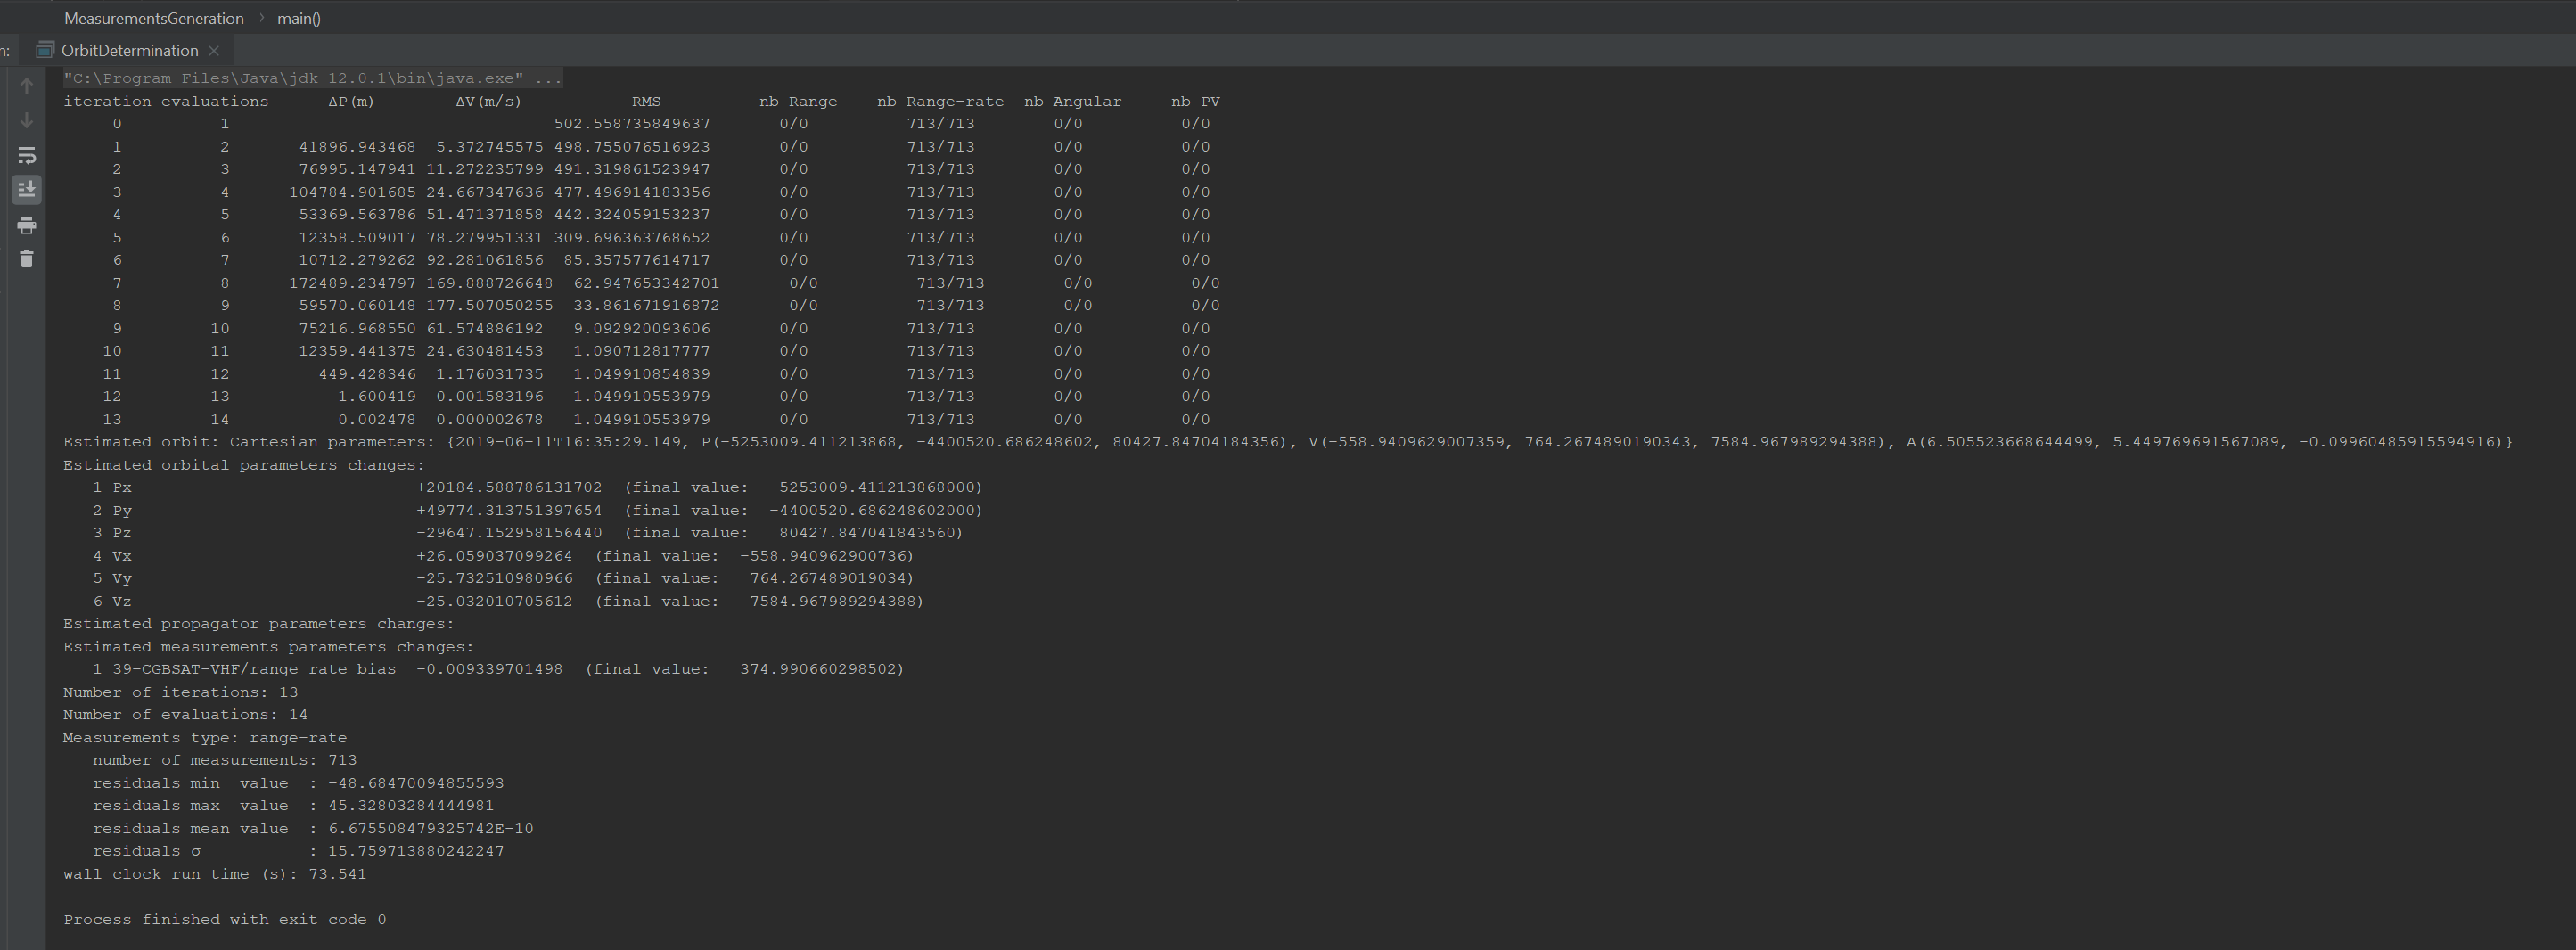
For the multiple stations I set a range.rate.bias=375m/s and range.rate.sigma=15 and I got the following results:
.
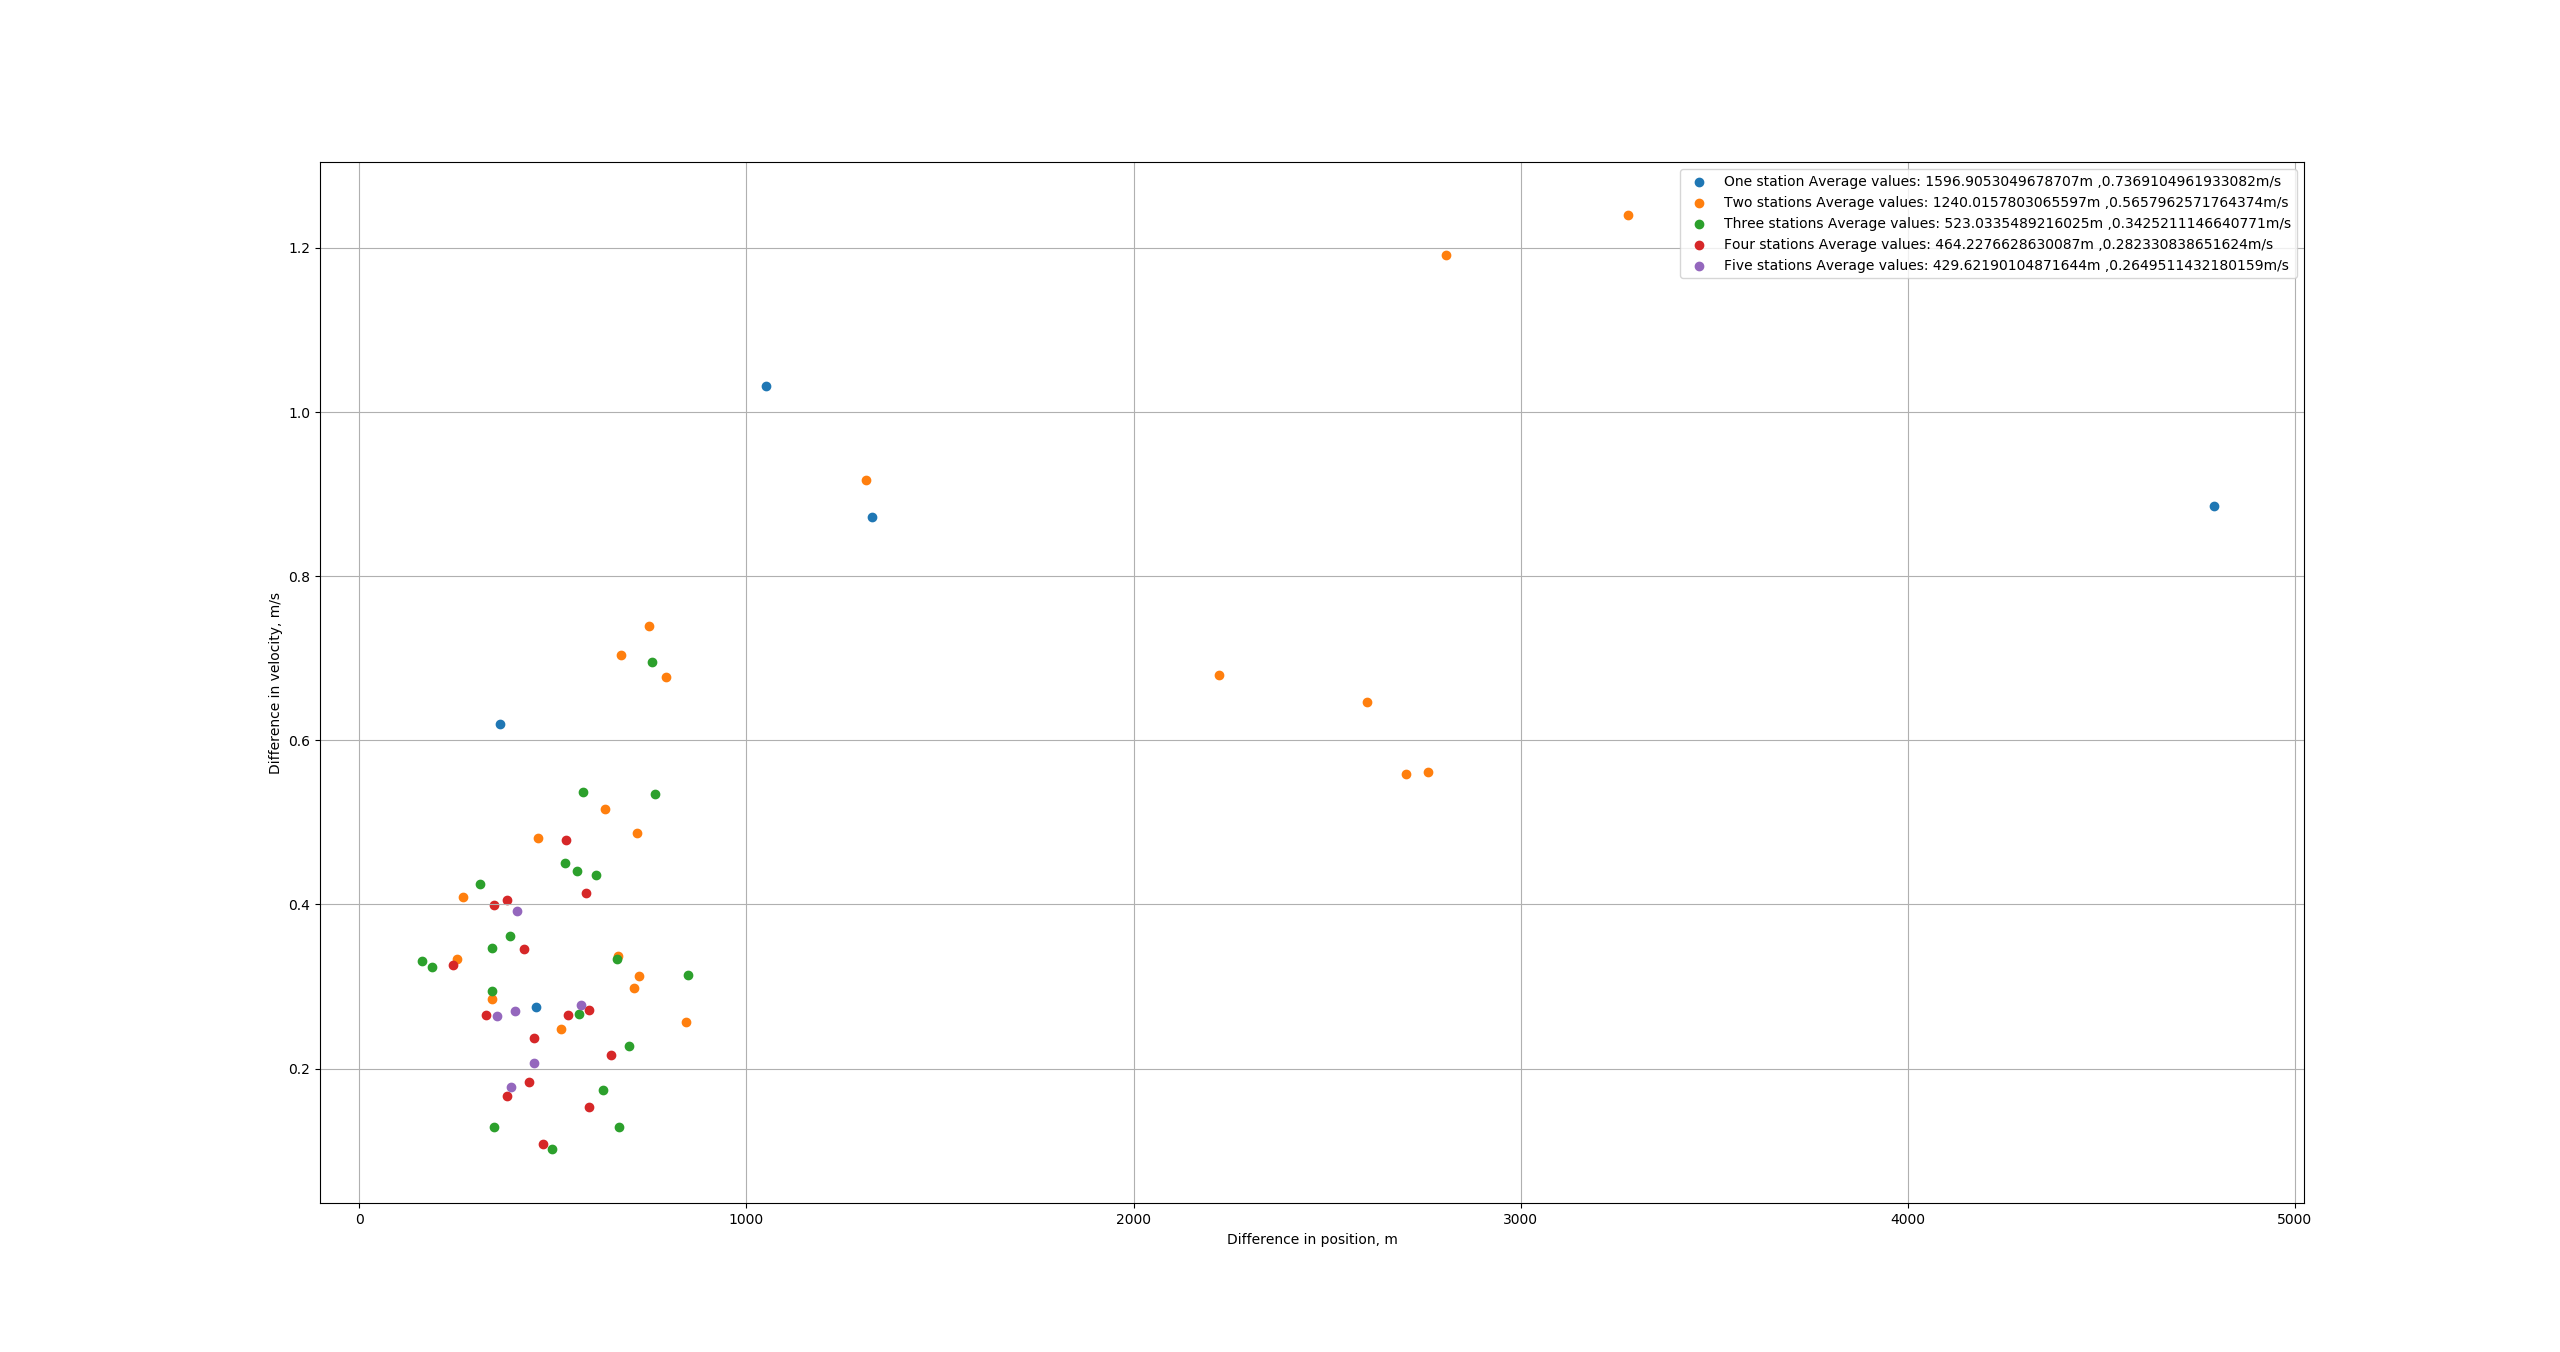
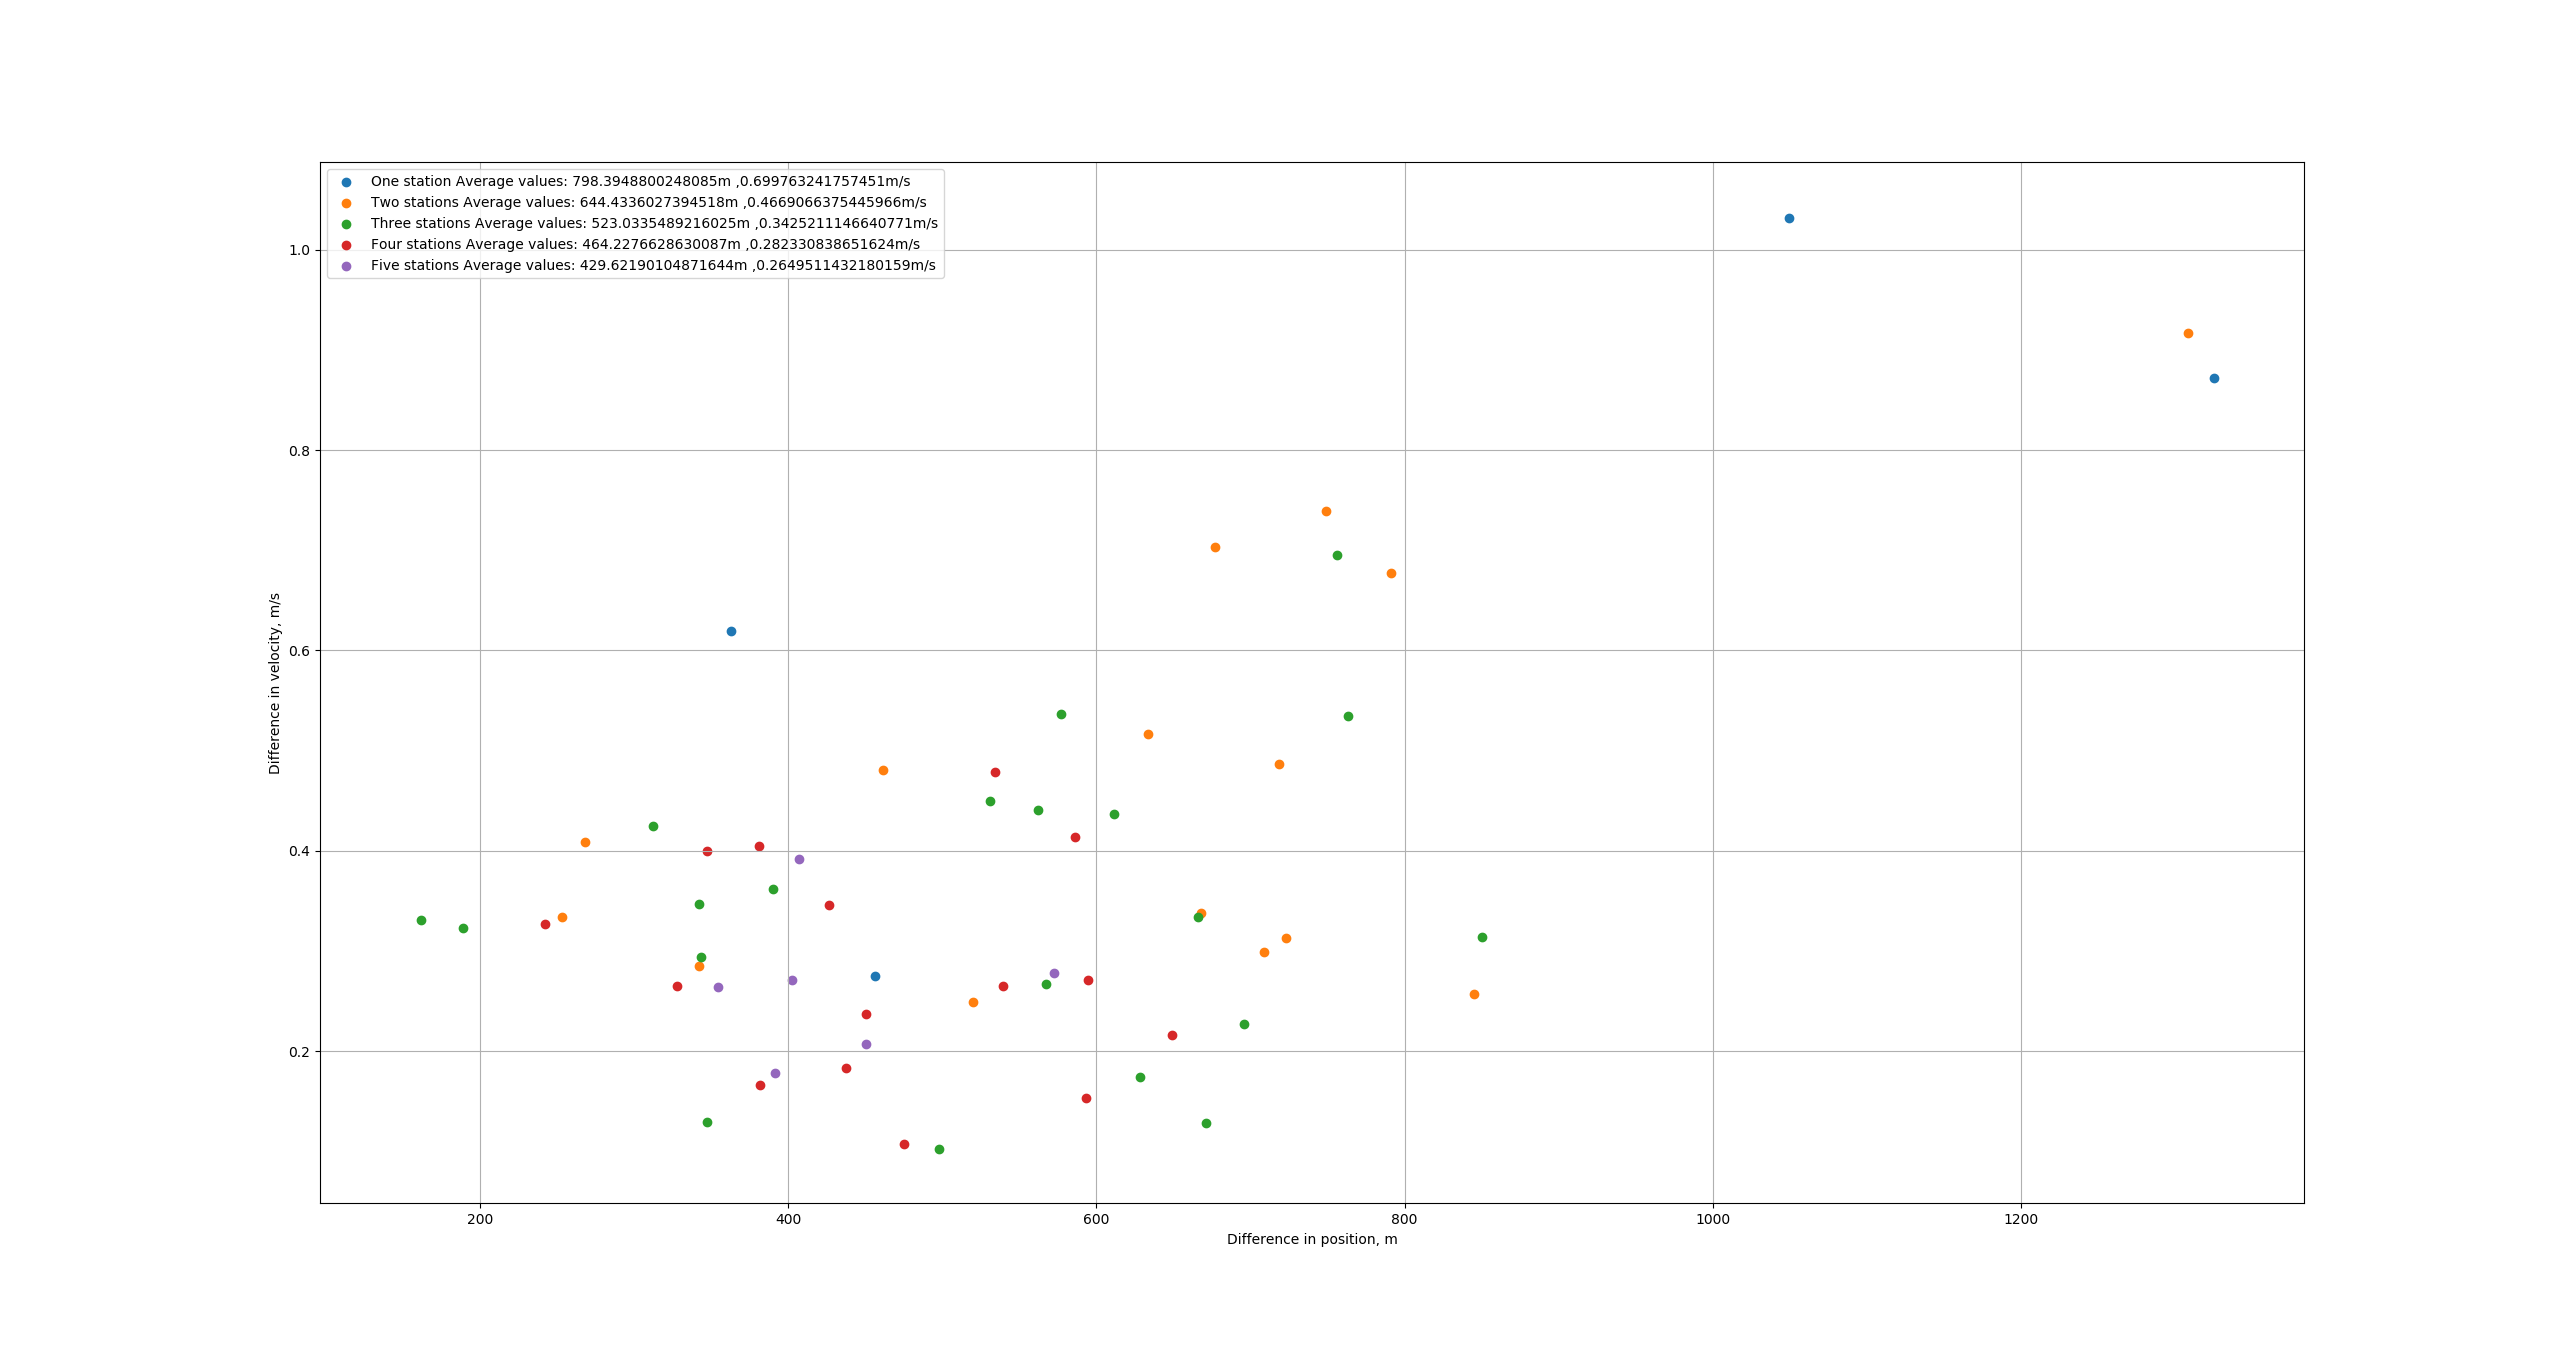
I noticed that all the major outliers stemmed from combinations including the GU-virt station, so I decided to discard this station (and all combinations with it) got the following plot:
This shows that increasing the number of stations used in the OD does, in general, improve the accuracy of the estimated position. That being said, it did appear that a careful selection of stations could yield better results with fewer stations.
An example of this is the combination of 39-CGBSAT-VHF and Marcs which gives an estimated position that is 342m away from that used in the generation (which isn’t amazing, but we are most likely limited by the Doppler noise.)
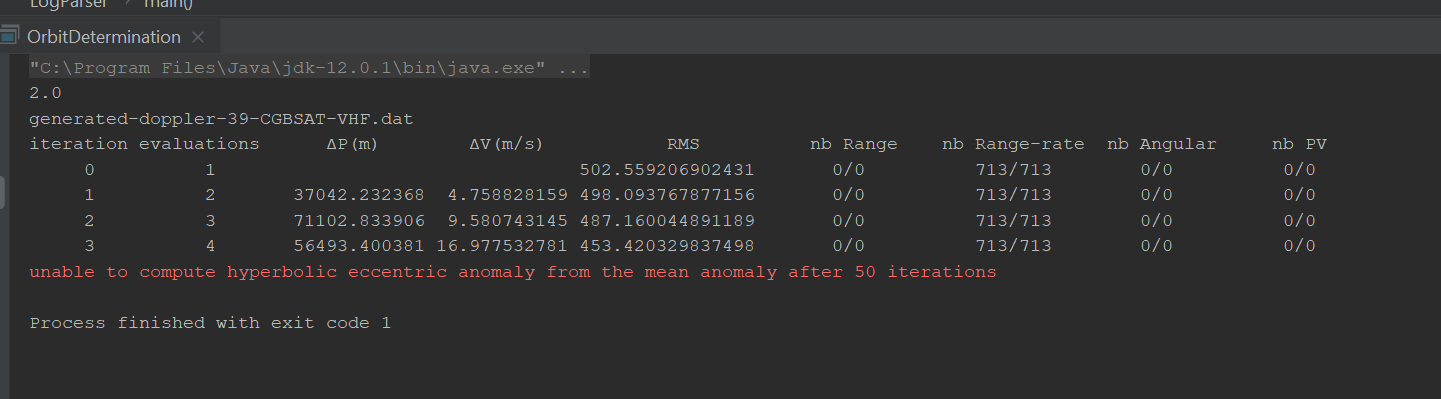
Changing the coefficient of drag
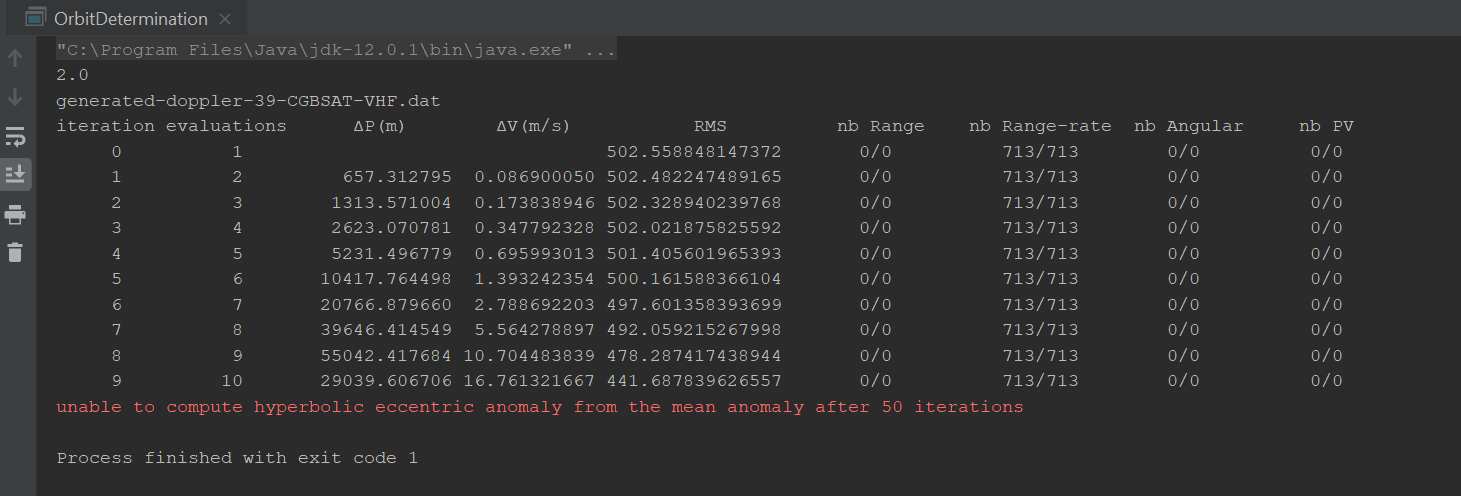
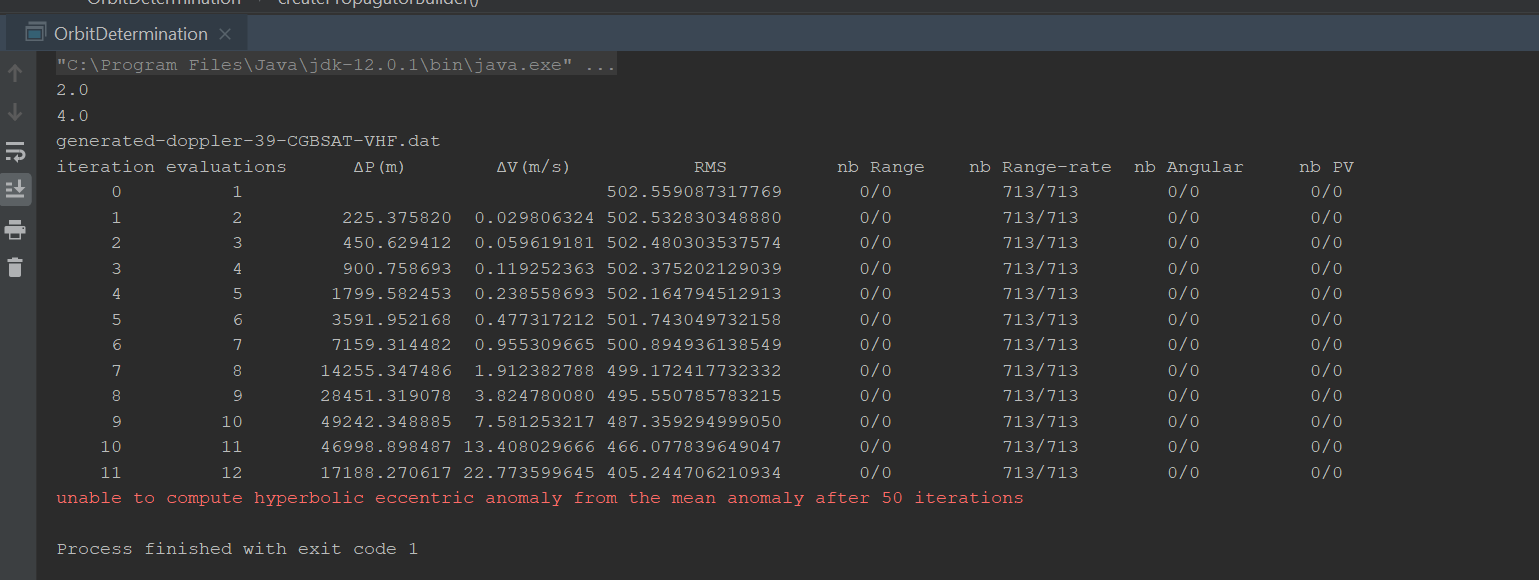
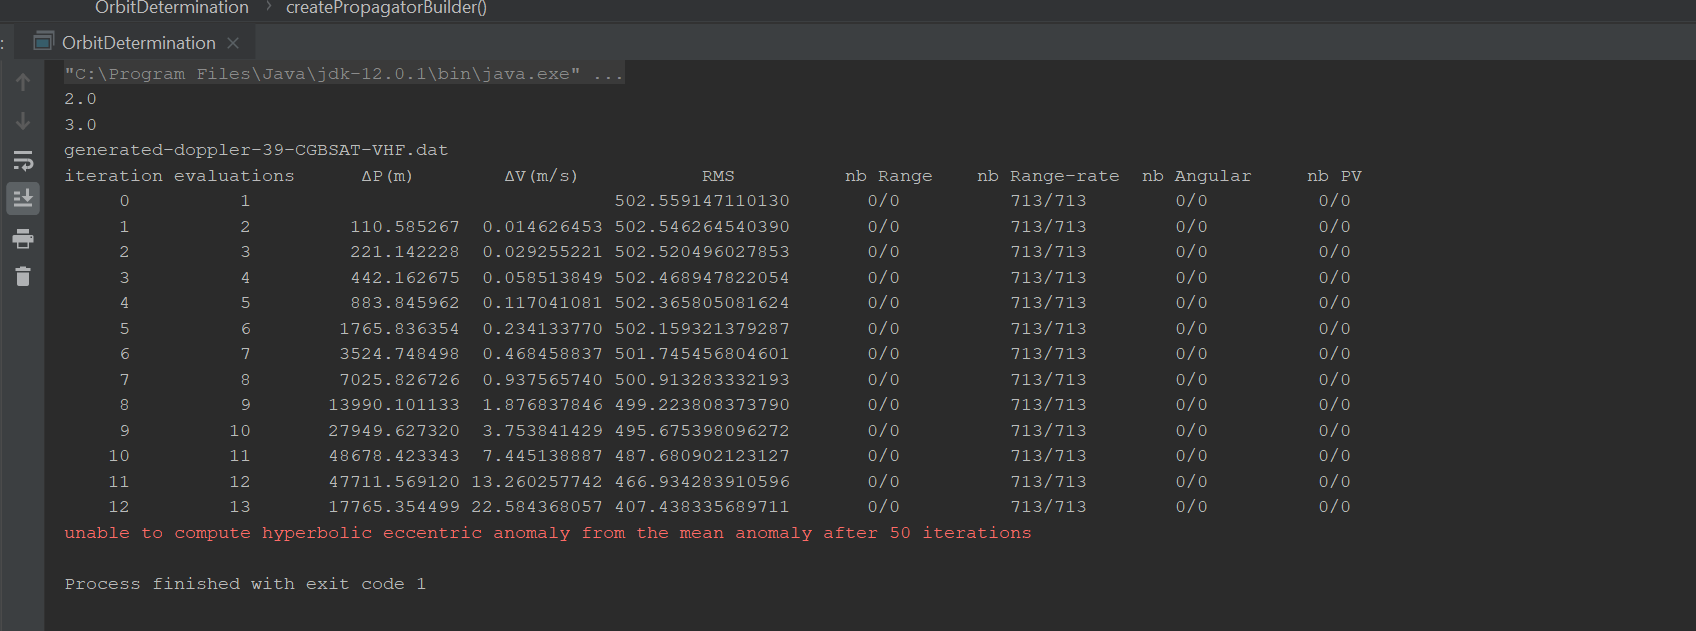
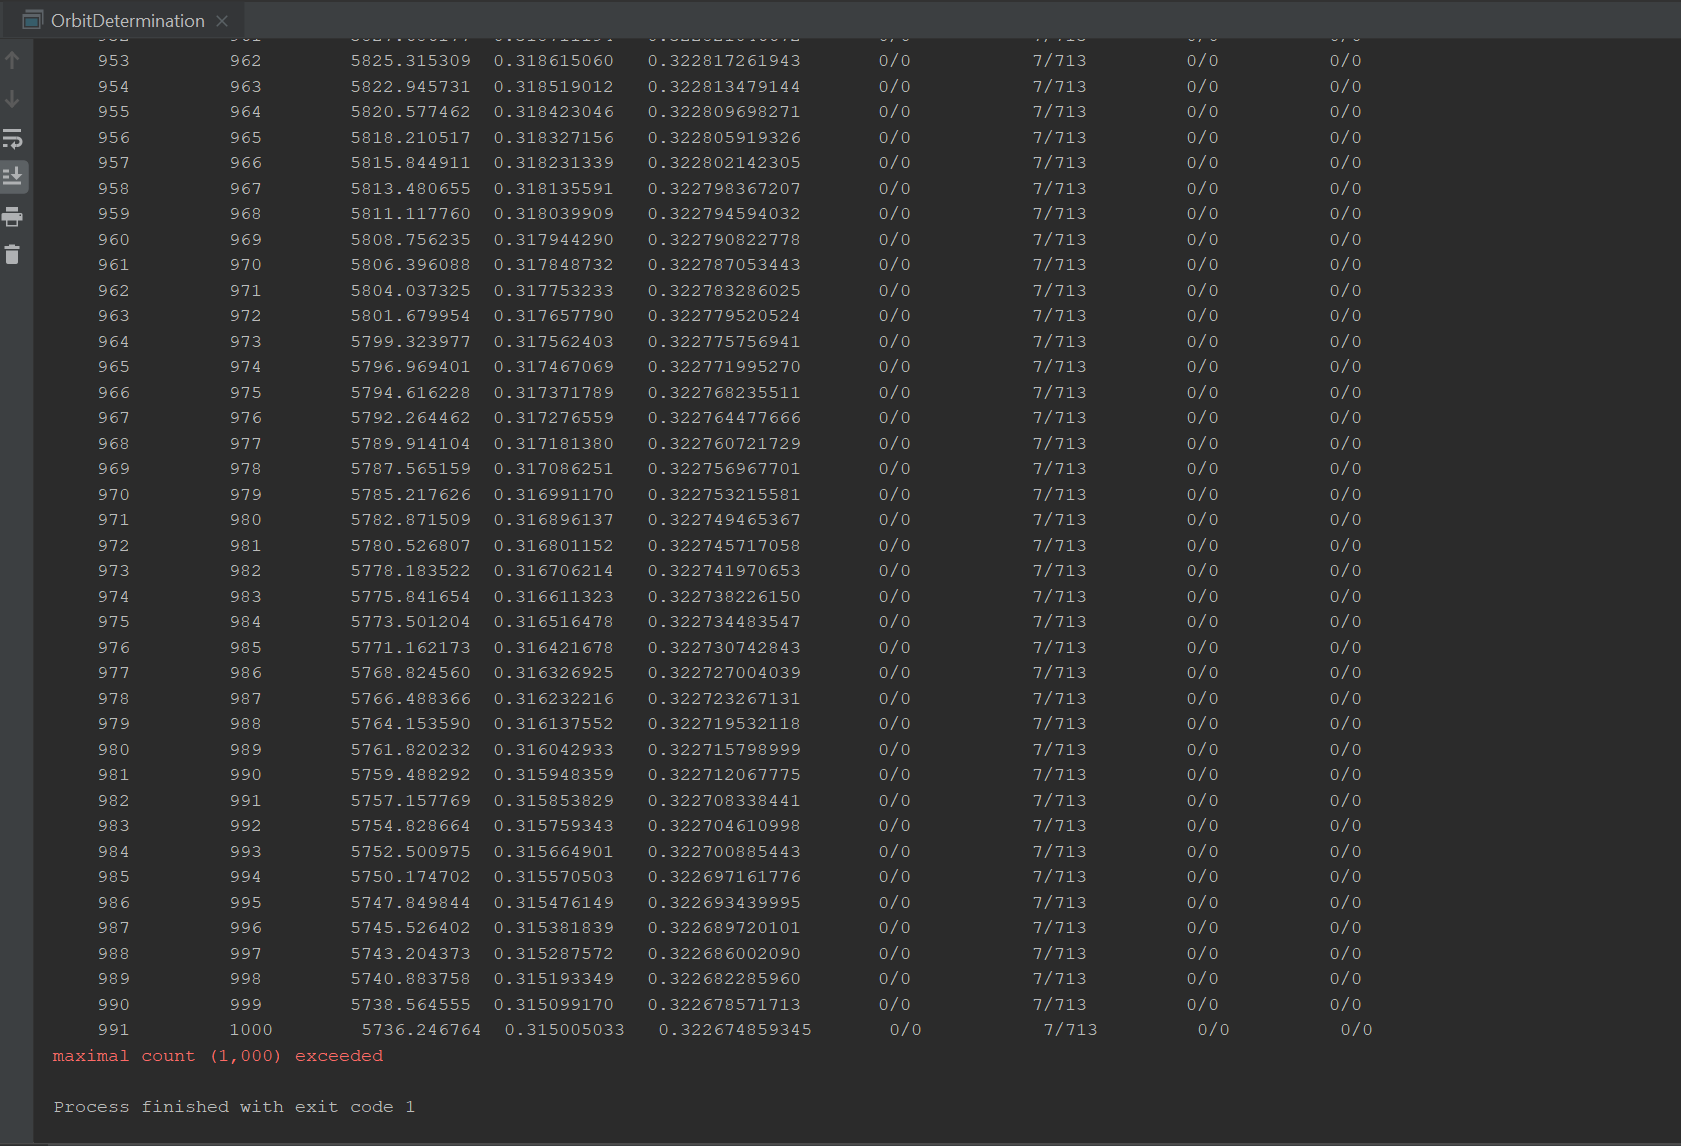
When I tried to run the OD with the estimated CD flag set to true, they all failed with the following error:
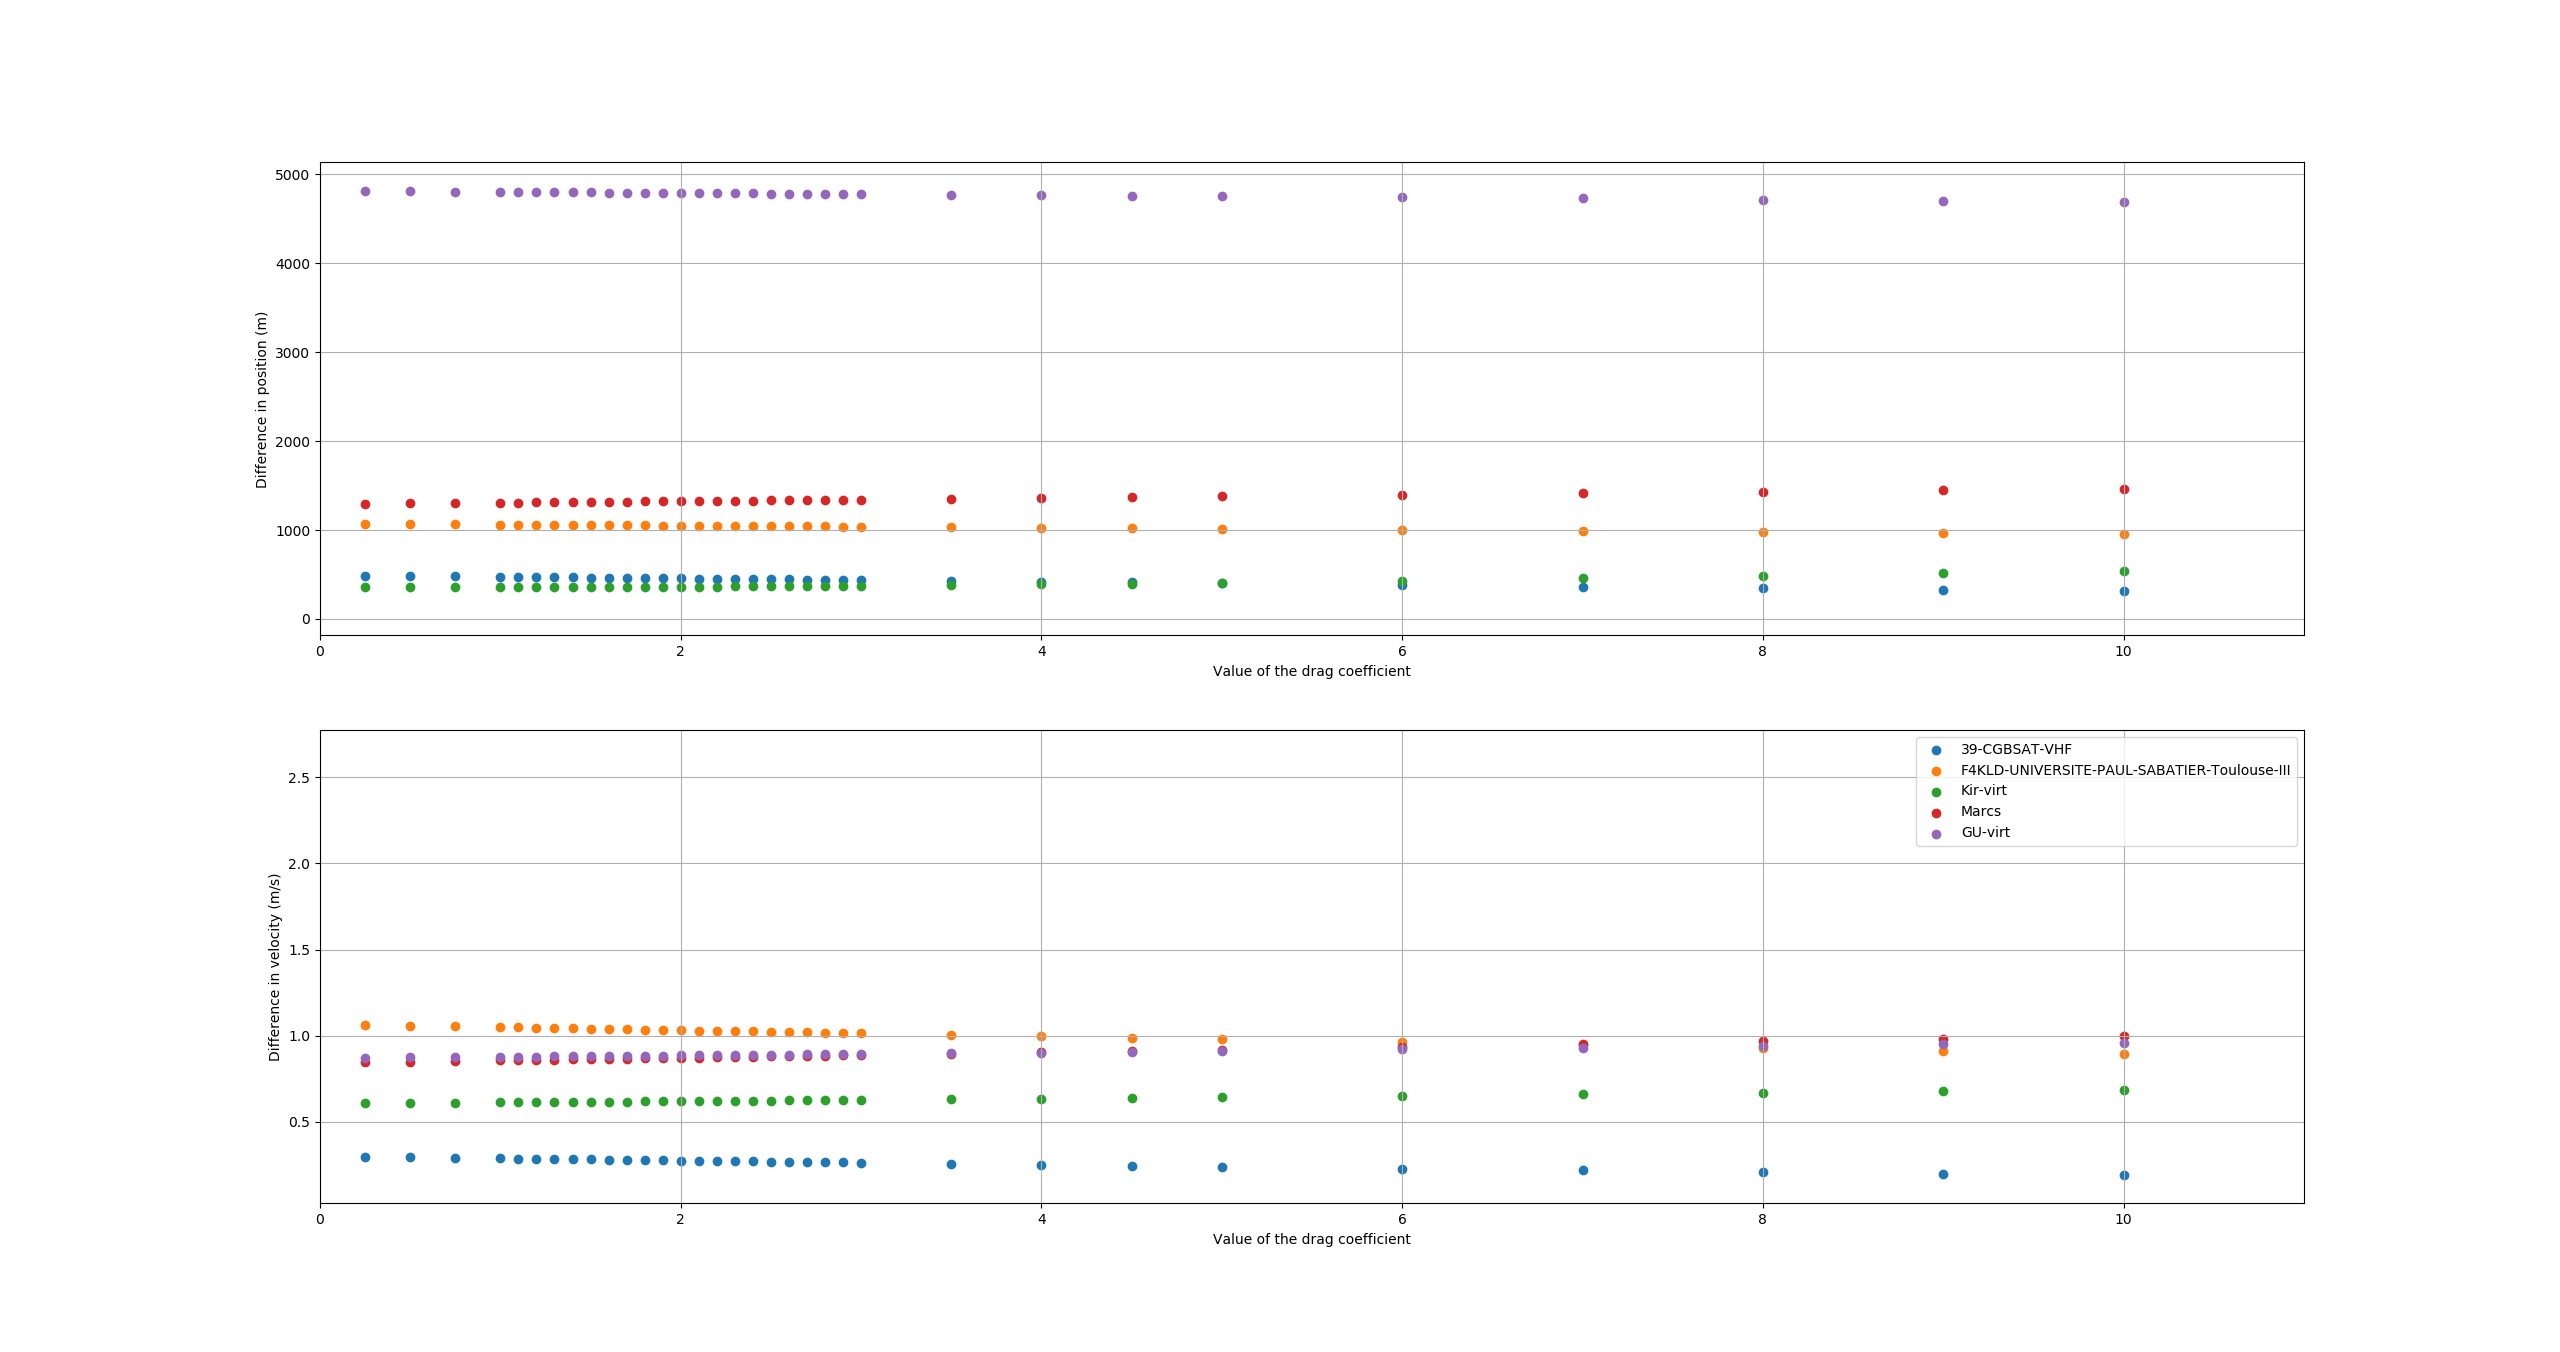
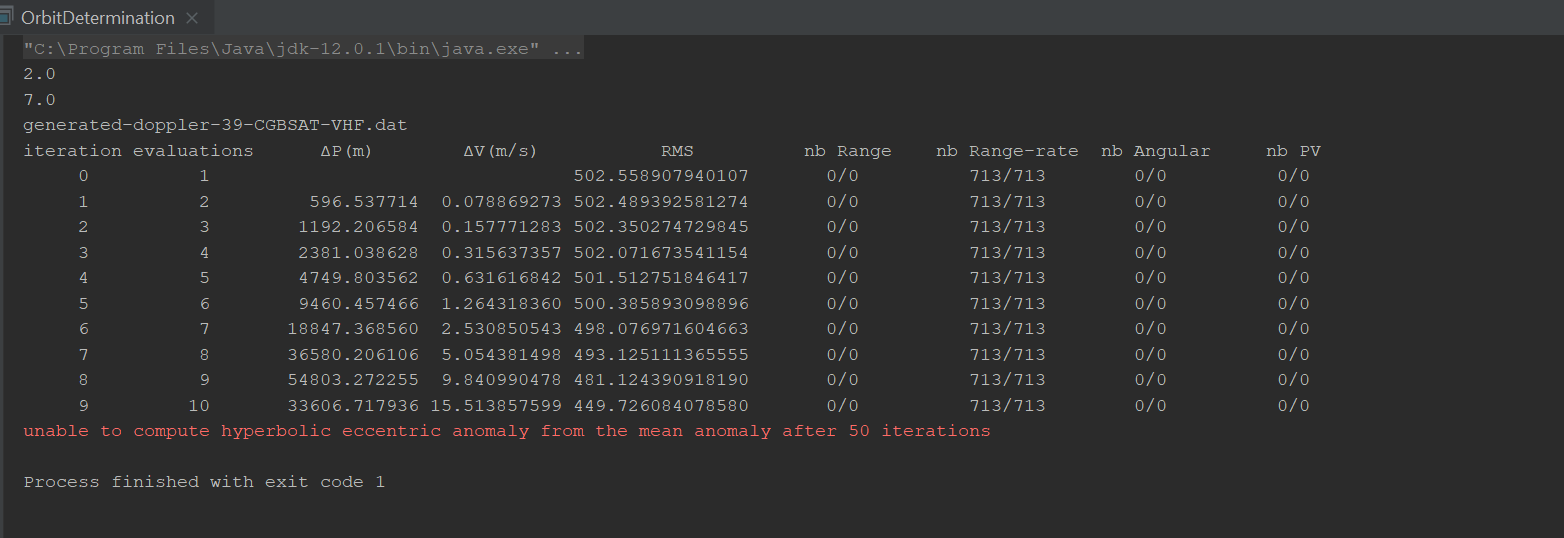
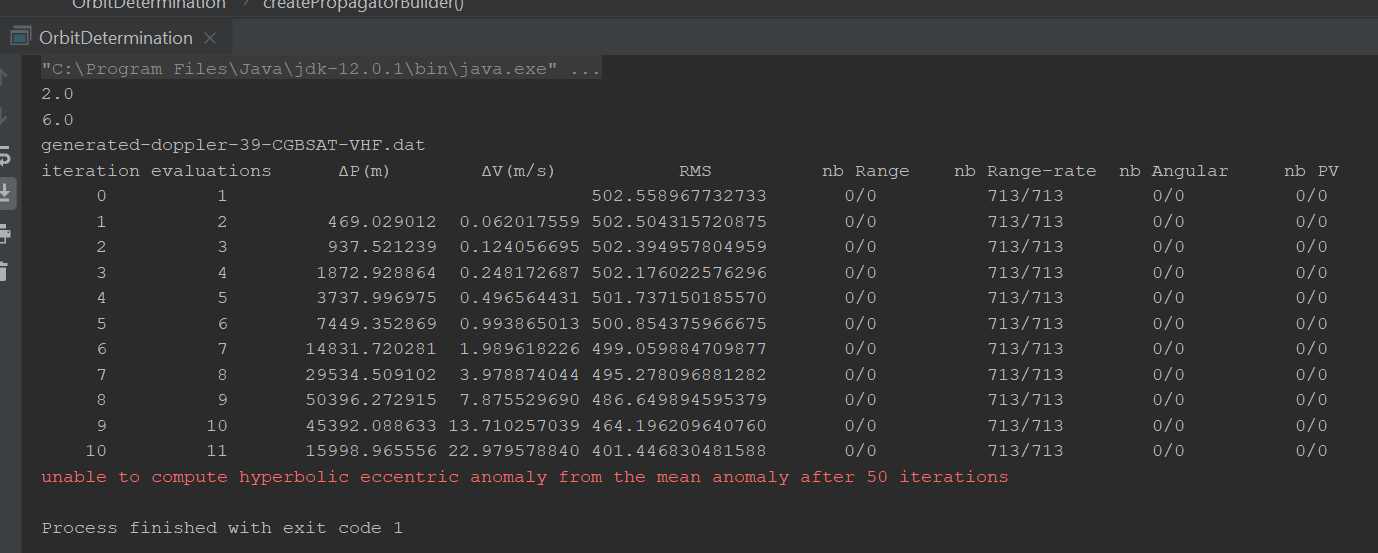
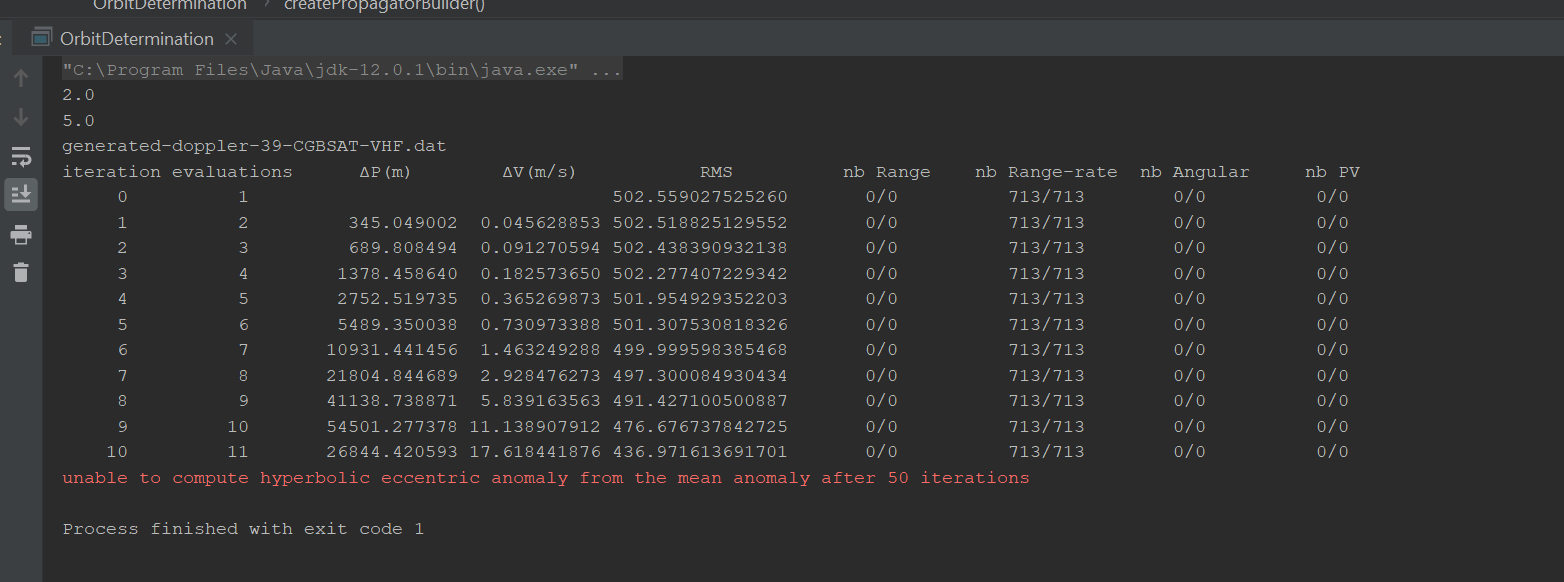
When I set the CD to be an incorrect value (with drag.cd.estimated = false) I got the following series of results (a Cd of 2 is used in the measurement generation):
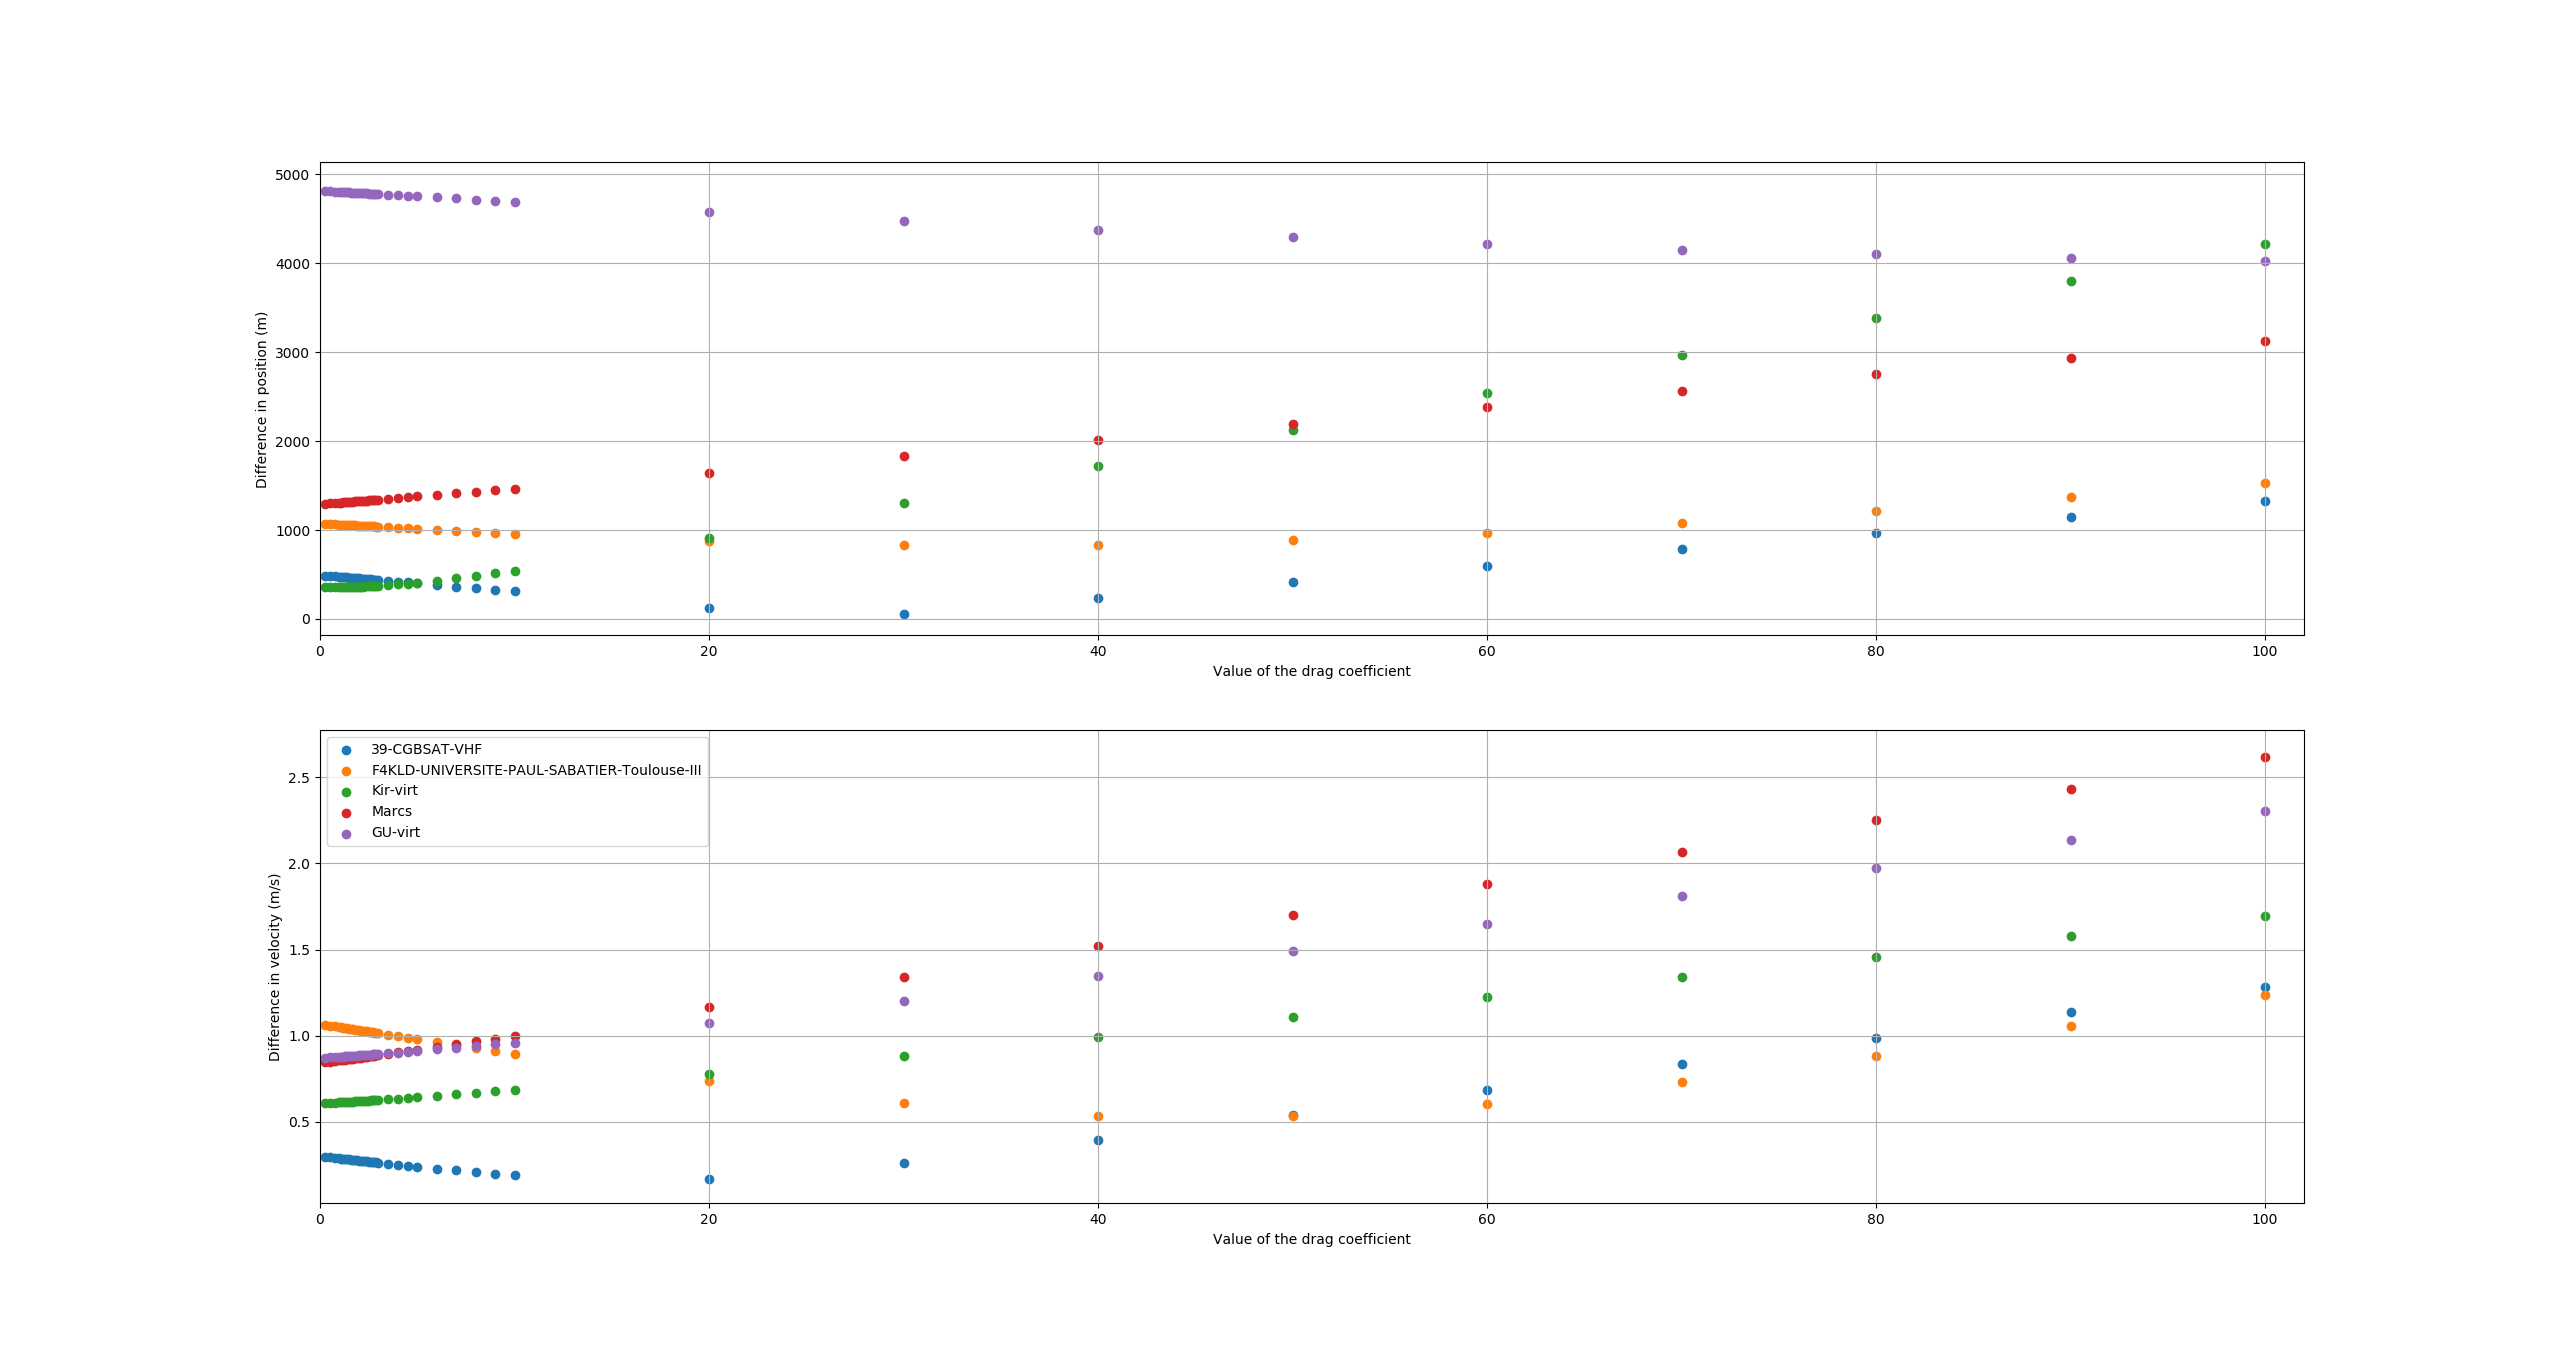
This made me wonder if this nearly flat behaviour continued to higher drag coefficients (I suspected that it didn’t, but wanted to confirm that this was the case,) so I added in another couple measurements to give the following:
These plots seem to indicate that a slight error in the drag coefficient used in the input file is tolerable, and doesn’t have much of an effect on the estimated parameters, as long as it isn’t wildly inaccurate.
Next steps
I was thinking of looking at the influence of adjusting the range-rate bias next, potentially with a variety of standard deviations as well, to see what impact that would have on the accuracy of the estimated parameters.
PS. I have uploaded all the data files used for these plots to the git repository