Dear Orekit community,
I am trying to set up a pipeline to estimate an orbit with ranges obtained from satellite laser ranging with a TLE as an initial guess. For this a TLE of TOPEX/Poseidon is used to generate a CPF-file, which then allows ranges to the satellite being measured by the SLR-station Zimmerwald. For this measuring session the TLE of that day was quite accurate and measurements could be obtained.
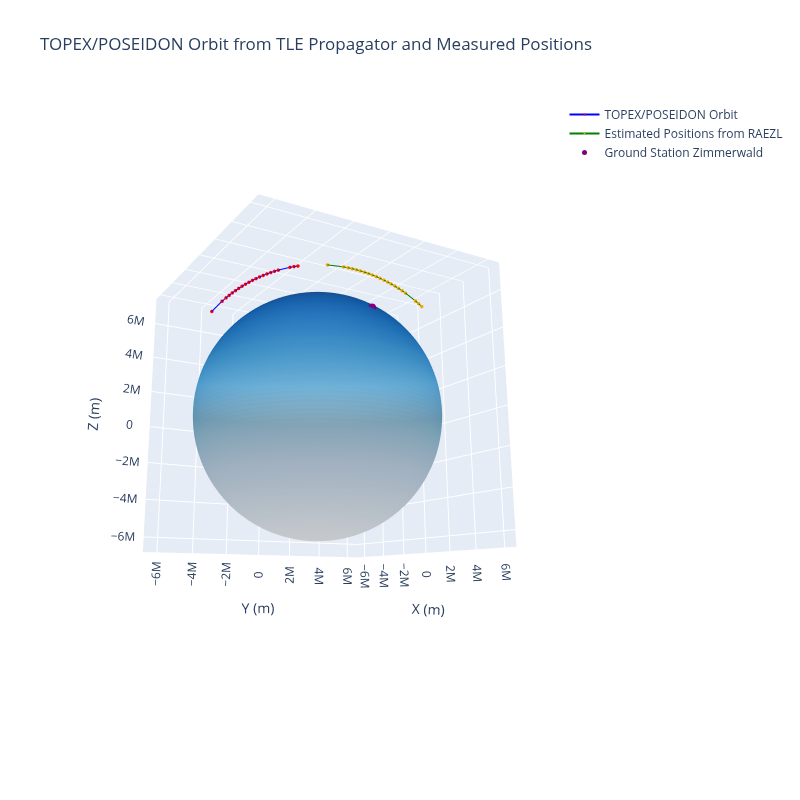
When trying to visualize the tracking geometry I noticed the following problem: The satellite positions generated from the TLEPropagator appear to be below the horizon of the ground station while the positions generated from the measurements form a sensible arc above it.
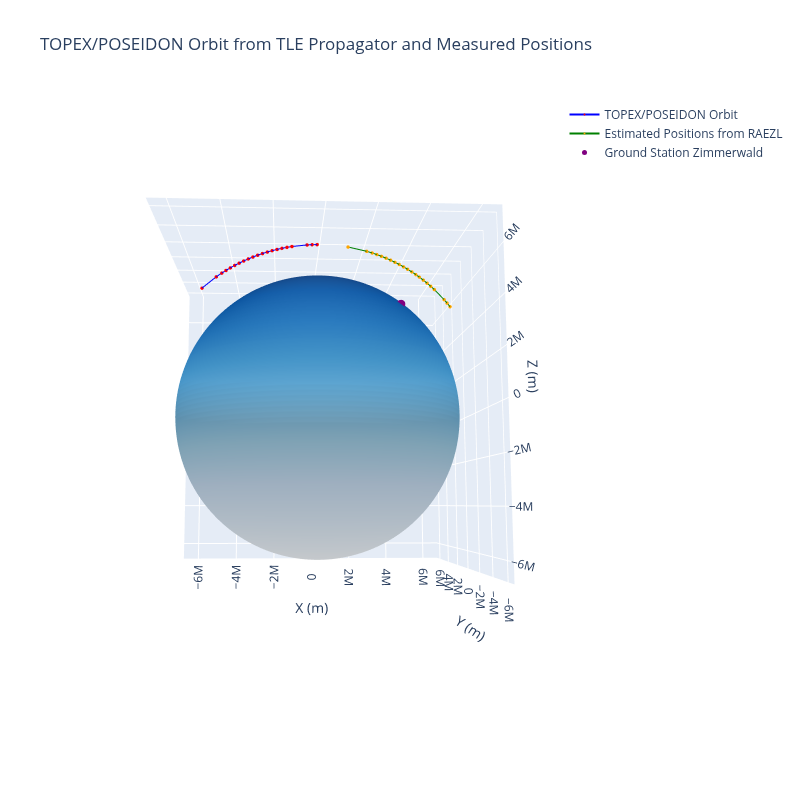
Looking at the two arcs, it looks like something might be wrong with the timestamps, but I already made sure that all times are given in UTC. What am I doing wrong here? The code to reproduce the problem and my measurements are below.
Thanks for any ideas and cheers,
Pascal
import pandas as pd
import numpy as np
import plotly.graph_objects as go

import orekit
orekit.initVM()
from orekit.pyhelpers import setup_orekit_curdir, download_orekit_data_curdir, datetime_to_absolutedate
# download_orekit_data_curdir("../orekit-data.zip")
setup_orekit_curdir("../orekit-data.zip")
from org.orekit.time import AbsoluteDate, TimeScalesFactory
from org.orekit.propagation.analytical.tle import TLE, TLEPropagator
from org.orekit.attitudes import NadirPointing
from org.orekit.frames import FramesFactory, TopocentricFrame
from org.orekit.utils import IERSConventions
from org.orekit.utils import Constants
from org.orekit.bodies import OneAxisEllipsoid, GeodeticPoint

topex_df = pd.read_csv("data/topex_slr_normal_points_small.csv")
topex_df['TIMESTAMP'] = pd.to_datetime(topex_df['TIMESTAMP'])
absolute_dates = [datetime_to_absolutedate(ts) for ts in topex_df['TIMESTAMP']]

ITRF = FramesFactory.getITRF(IERSConventions.IERS_2010, False)
EME2000 = FramesFactory.getEME2000()
earth = OneAxisEllipsoid(Constants.WGS84_EARTH_EQUATORIAL_RADIUS,
                         Constants.WGS84_EARTH_FLATTENING,
                         ITRF)

lat = float(np.deg2rad(46.8772))
lon = float(np.deg2rad(7.4652))
alt = 951.2
name = "Zimmerwald"
point = GeodeticPoint(lat, lon, alt)
zwd_topo_frame = TopocentricFrame(earth, point, name)

lat = float(np.deg2rad(46.8772))
lon = float(np.deg2rad(7.4652))
alt = 951.2
name = "Zimmerwald"
point = GeodeticPoint(lat, lon, alt)
zwd_topo_frame = TopocentricFrame(earth, point, name)

# TOPEX/POSEIDON
line1 = "1 22076U 92052A   25335.73517493 -.00000028  00000-0  14489-3 0  9992"
line2 = "2 22076  66.0382 182.4050 0007747 271.8090 157.2908 12.81088102558197"
mass_topex = 2675.9  # kg from DISCOS
tle = TLE(line1, line2)
attitude_provider = NadirPointing(EME2000, earth) # real object is tumbling
tle_prop = TLEPropagator.selectExtrapolator(tle, attitude_provider, mass_topex)
# Equivalent results to TLEPropagator.selectExtrapolator(tle)

ok_vecs = [cpf_propagator.propagate(t).getPosition(EME2000) for t in absolute_dates]
X = [v.getX() for v in ok_vecs]
Y = [v.getY() for v in ok_vecs]
Z = [v.getZ() for v in ok_vecs]

station_pos = zwd_topo_frame.getPosition(absolute_dates[0], EME2000)
x_station = station_pos.getX()
y_station = station_pos.getY()
z_station = station_pos.getZ()

def RAzEl(ranges, azimuths, elevations, timestamps, frame=EME2000):
    """Convert range, azimuth, elevation to position vectors in given frame."""
    pos_vectors = []
    for range, azimuth, elevation, timestamp in zip(ranges, azimuths,
                                                    elevations, timestamps):
        sat_geo_point = zwd_topo_frame.pointAtDistance(
            float(np.deg2rad(azimuth)),
            float(np.deg2rad(elevation)),
            range)
        sat_topo = TopocentricFrame(earth, sat_geo_point, "Satellite_Pos")
        sat_vector3d = sat_topo.getPosition(timestamp, frame)
        sat_vector_pos = np.array([sat_vector3d.getX(),
                                   sat_vector3d.getY(),
                                   sat_vector3d.getZ()])
        pos_vectors.append(sat_vector_pos)
    return pos_vectors

sat_est_positions = RAzEl(topex_df["RANGE"],
                          topex_df["AZI"],
                          topex_df["ELE"],
                          absolute_dates)
x_meas, y_meas, z_meas = zip(*sat_est_positions)

# Plot TLE orbit
fig = go.Figure(data=[go.Scatter3d(x=X, y=Y, z=Z,
                                   name='TOPEX/POSEIDON Orbit',
                                   mode='lines+markers',
                                   line=dict(color='blue', width=2),
                                   marker=dict(size=2, color='red'))])
# Plot measured positions from RAEZL
fig.add_trace(go.Scatter3d(x=x_meas, y=y_meas, z=z_meas,
                           mode='lines+markers',
                           line=dict(color='green', width=2),
                           marker=dict(size=2, color='orange'),
                           name='Estimated Positions from RAEZL'))
# Plot ground station position
fig.add_trace(go.Scatter3d(x=[x_station], y=[y_station], z=[z_station],
                           mode='markers',
                           marker=dict(size=5, color='purple'),
                           name='Ground Station Zimmerwald'))

theta = np.linspace(0, 2 * np.pi, 100)
phi = np.linspace(0, np.pi, 100)

# Set up coordinates for points on the sphere
R_E = 6368.134 * 1000
x0 = R_E * np.outer(np.cos(theta), np.sin(phi))
y0 = R_E * np.outer(np.sin(theta), np.sin(phi))
z0 = R_E * np.outer(np.ones(100), np.cos(phi))

# Set up surface plot for Earth
fig.add_trace(go.Surface(x=x0, y=y0, z=z0,
                         hoverinfo="none",
                         colorscale='Blues',
                         contours_x_highlight=False,
                         contours_y_highlight=False,
                         contours_z_highlight=False,
                         showscale=False))

fig.update_layout(title="TOPEX/POSEIDON Orbit from TLE Propagator and Measured Positions",
                  scene=dict(xaxis_title='X (m)',
                             yaxis_title='Y (m)',
                             zaxis_title='Z (m)'),
                  width=800,
                  height=800)
fig.show()
topex_slr_normal_points_small.csv (1.8 KB)