Hello all,
I am currently trying to analyze different possibilities of orbits with repeating ground track. As a first step, I am using the method mentioned in https://arc.aiaa.org/doi/abs/10.2514/1.A32038?journalCode=jsr to obtain the semi-major axis (and altitude) based input eccentricity and inclination of the orbit. As an example, I obtain that for an eccentricity = 0.0 and inclination 97.0°, I obtain that I should have a repeating ground track for an orbit semi-major axis of 6938.013km (559.8764km altitude).
If I try to propagate such an orbit for more than 1 day though, I obtain that the resulting ground track is very close to the first cycle one, but not exactly aligned, as shown in the plot below.
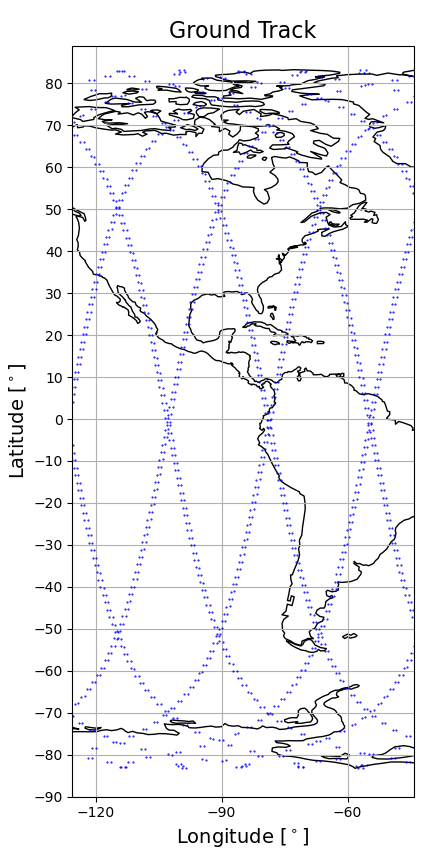
I have attached below my current code for the numerical propagation and ground track generation: have I made some errors in the code? Do you obtain a repeating ground-track orbit with such parameters? I am currently only implementing a numerical propagator without any additional perturbation other than gravitational ones, therefore I would expect to see a matching ground-track…
year = 2026
month = 1
day = 1
hour = 6
minute = 0
seconds = 03.146
date_propagation = '2026-01-01T06:00:03.416'

J2 = -Constants.EIGEN5C_EARTH_C20

h = 559.8764
a = Constants.WGS84_EARTH_EQUATORIAL_RADIUS + h*1e3
e = 0.0
mu_e = Constants.EIGEN5C_EARTH_MU
R_e = Constants.WGS84_EARTH_EQUATORIAL_RADIUS
i = radians(97)
omega = radians(90.0)                                               # Orbit perigee argument [rad]
raan = radians(10.5)
true_anomaly = radians(0.0)                                        # Spacecraft true anomaly [rad]

inertialFrame = FramesFactory.getEME2000()

utc = TimeScalesFactory.getUTC()
epochDate = AbsoluteDate(year, month, day, hour, minute, seconds, utc)
epoch = Time(date_propagation)

initialOrbit = KeplerianOrbit(a, e, i, omega, raan, true_anomaly,
                              PositionAngle.TRUE,
                              inertialFrame, epochDate, Constants.EIGEN5C_EARTH_MU)

period = initialOrbit.getKeplerianPeriod()

satellite_mass = 70. #37.                    # Spacecraft mass [kg]

duration =  2*60*60*24                                                # Propagation duration [s]
step_time = period/200                                                     # Propagation step-time [s]

# Numerical propagator definition
# Step size
minStep = 0.001
maxStep = step_time
initStep = step_time
positionTolerance = 1E-8
propagationType = OrbitType.CARTESIAN
tolerances = NumericalPropagator.tolerances(positionTolerance, initialOrbit, propagationType)
initialDate = epochDate
integrator = DormandPrince853Integrator(minStep, maxStep, orekit.JArray('double').cast_(tolerances[0]), orekit.JArray('double').cast_(tolerances[1]))
integrator.setInitialStepSize((initStep))

numericalPropagator = NumericalPropagator(integrator)
numericalPropagator.setOrbitType(propagationType)

# Generate ground track
ITRF = FramesFactory.getITRF(IERSConventions.IERS_2010, True)
earth = OneAxisEllipsoid(Constants.WGS84_EARTH_EQUATORIAL_RADIUS,
                         Constants.WGS84_EARTH_FLATTENING,
                         ITRF)

gravityProvider1 = GravityFieldFactory.getNormalizedProvider(20, 20)
numericalPropagator.addForceModel(HolmesFeatherstoneAttractionModel(earth.getBodyFrame(), gravityProvider1))
numericalPropagator.setInitialState(SpacecraftState(initialOrbit, satellite_mass))


t = [initialDate.shiftedBy(float(dt)) for dt in np.arange(0, duration, step_time)]

initialState = numericalPropagator.propagate(initialDate.shiftedBy(float(1E-10)))
numericalPropagator.setInitialState(initialState)
spacecraft1 = [numericalPropagator.propagate(tt) for tt in t]

pv = [x.getPVCoordinates() for x in spacecraft1]
p = [tpv.getPosition() for tpv in pv]

subpoint = [earth.transform(tp, inertialFrame, tt) for tt, tp in zip(t, p)]
lat = np.degrees([gp.getLatitude() for gp in subpoint])
lon = np.degrees([gp.getLongitude() for gp in subpoint])

# Create plot of ground track
ax = plt.axes(projection=crt.crs.PlateCarree())
ax.coastlines()
ax.plot(lon[1:-1], lat[1:-1], 'b.',markersize=1)
ax.plot(lon[0], lat[0], 'g.',markersize=10)
ax.plot(lon[-1], lat[-1], 'r.',markersize=10)
ax.set_title(r"Ground Track", fontsize=16)
ax.set_xlabel(r'Longitude $[\mathrm{^\circ}]$',fontsize=14)
ax.set_ylabel(r'Latitude $[\mathrm{^\circ}]$',fontsize=14)
plt.xlim(-180, 180)
plt.ylim(-90, 90)
plt.yticks([-90, -80, -70, -60, -50, -40, -30, -20, -10, 0, 10, 20, 30, 40, 50, 60, 70, 80, 90])
plt.xticks([-180, -150, -120, -90, -60, -30, 0, 30, 60, 90, 120, 150, 180])
ax.grid(True)
plt.show()