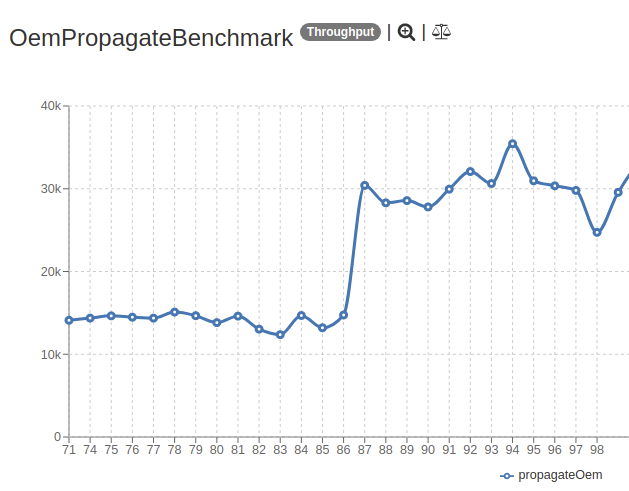
For a little while I’ve been keeping a set of JMH performance benchmarks for Orekit. I run it with Jenkins and the JMH Report Plugin to make nice graphs. It measures performance of a few selected features and produces graphs. For example, this one that shows (with some clicking) a side effect of merging the data-context branch is propagating an OEM ephemeris had a speedup of ~2.
Would the Orekit community be interested in a set of performance benchmarks? It will be a small set initially, but we can grow it. There have been a few performance related questions recently and this would be a tool for developers so we can know what improves performance and what doesn’t. Performance is goal number 3 for Orekit and this could provide some data to support that goal.
The biggest cost would probably be running the benchmarks routinely. The small set I have take about an hour to run and noting else can run on the machine at the same time or else it creates errors in the measurement. (That’s what makes all the bumps in the graph above.)
Nice work! In my humble opinion, tracking the performance of each algorithm (at least the key algorithms) over time is lacking.
If the community is interested in such performance benchmarks (I think that should be the case), I think we can create and dedicate a VM to this task (to be checked with my management).
Good question. Vertical axis is throughput in operations per second. In this case the the operation is calling propagate() on a propagator created from an OEM ephemeris. Horizontal axis is build number, which roughly corresponds with time. It gets built once a day if there are new commits in Orekit.
+1 from me too, if it’s possible in terms of infrastructure of course. Although tracking the Jenkins build durations for the unit tests suite does provide some information, this method seems much more accurate and focused on the critical algorithms.
I’m not sure I understand how to read the plots though. Does the steep increase means that performance has improved, because there are more calls to propagate() in the same amount of time ?
For hardware I don’t think the requirements are too specific. Consistency over time is more important than having a fast machine. All benchmarks are currently single threaded. There should be enough RAM to run two JVMs without paging.
For software the benchmarks are implemented in their own maven project. I’ll push the code up this week. So we would need maven. The maven build produces a JMH json file, an example is attached [2]. I run it with Jenkins and use [1] to make the plots, which is nice because it compares the output from all builds. Can GitLab be set up to do something similar?
As I understand it, the Jenkins plugin (jmh-report) reads the report generated by the JMH tool and pushes it on JMH Visualizer to get back the graph. Am I right?
If it is the case, Gitlab CI can run JMH tool (through a new job, scheduled once a day) and the graph could probably be published on a specific page of our server, possibly on a dedicated virtual host (like https://perf.orekit.org). We must carry out some tests to verify it.
P.S.: Once again, I remind you that I know nothing about Java. If I say something stupid, don’t hesitate to correct me, my ego will survive it.
I pushed the code here: Sign in · GitLab
I’m not sure if that is the right place for it. I’m still leaning GitLab so I won’t be offended if you tell me I’m doing it wrong.
Yes.
You can run the benchmarks with the command mvn clean verify && java -jar target/benchmarks.jar -f 3 -rf json -rff target/jmh-result.json which generates the named json file. The -f option controls how many times it runs. Larger numbers take longer but give smaller error bars.
I finally got a workaround implemented for running the performance tests without Jenkins. Now they will run and visualize on GitLab. Could you help me get an runner? Or show me what I should be doing to use the existing runners? Currently GitLab says the pipeline is stuck: Sign in · GitLab