Hello everyone !
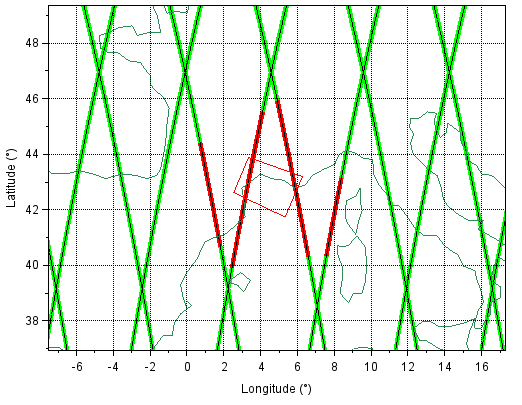
I’m actually trying to determine when a camera can see totally or a part of a Zone of Interest (ZOI), fixed on earth and created by four points. The objective is to obtain the date when the camera can see this zone through the FOV of the camera, and to obtain the groundtrack by changing the color of the groundtrack when the camera see the zone, such as in the following picture :

To do so, I’m using FootprintOverlapDetector as described in other discussions.
The thing is, I don’t know how to modify my code in order to get (maybe through the handler or using getFootprint ? ) the latitude and longitude when the camera see the ZOI. Would you have any ideas ?
Here is the code
import orekit
vm=orekit.initVM()
from orekit import JArray_double
from orekit.pyhelpers import setup_orekit_curdir
import os
current_path = os.path.dirname(os.path.abspath(__file__))
orekit_path = os.path.join(current_path, 'orekit_database')
setup_orekit_curdir(orekit_path)

import pandas as pd
from org.orekit.propagation import Propagator;
from org.hipparchus.geometry.euclidean.threed import Vector3D
from org.orekit.bodies import OneAxisEllipsoid
from org.orekit.frames import FramesFactory
from org.orekit.propagation.sampling import PythonOrekitFixedStepHandler
from org.orekit.propagation import SpacecraftState
from org.hipparchus.ode.nonstiff import DormandPrince853Integrator
from org.orekit.forces.drag import DragForce, IsotropicDrag
from org.orekit.models.earth.atmosphere import NRLMSISE00
from org.orekit.orbits import KeplerianOrbit, OrbitType, PositionAngleType
from org.orekit.utils import Constants, IERSConventions
from org.orekit.time import AbsoluteDate, TimeScalesFactory
from org.orekit.propagation.numerical import NumericalPropagator
from org.orekit.propagation.events.handlers import StopOnEvent, ContinueOnEvent
from org.orekit.models.earth.atmosphere.data import MarshallSolarActivityFutureEstimation
from org.orekit.propagation import *
from org.orekit.propagation.sampling import *
from org.orekit.forces.radiation import IsotropicRadiationSingleCoefficient
from org.orekit.forces.radiation import SolarRadiationPressure
from org.orekit.forces.gravity.potential import GravityFieldFactory
from org.orekit.forces.gravity import HolmesFeatherstoneAttractionModel
from java.util import List
from orekit import JArray_double
from org.hipparchus.util import FastMath
from org.orekit.attitudes import NadirPointing
from org.orekit.bodies import CelestialBodyFactory, GeodeticPoint
from org.orekit.geometry.fov import DoubleDihedraFieldOfView, FieldOfView
from org.orekit.models.earth.tessellation import EllipsoidTessellator
from org.orekit.propagation.events import FootprintOverlapDetector
from org.orekit.propagation.events import EventsLogger, EventSlopeFilter, FilterType
from datetime import datetime
import plotly.express as px
import plotly.graph_objects as go
import math

def Handler_for_plot_Definition():
    class HandlerForDate(PythonOrekitFixedStepHandler):

        def init(self, so, t, step):
            super().__init__()
            self.data = {
                'dates': [],
                'latitude': [],
                'longitude': [],
            }
            self.print_counter = 0

        def handleStep(self, state):
            date = state.getDate()
            pv_coordinates = state.getPVCoordinates(earth.getBodyFrame())
            geodetic_point = earth.transform(pv_coordinates.getPosition(), earth.getBodyFrame(), date)
            latitude = math.degrees(geodetic_point.getLatitude())
            longitude = math.degrees(geodetic_point.getLongitude())


            self.data['latitude'].append(latitude)
            self.data['longitude'].append(longitude)

            # The date is used in the groundtrack plot
            date_str = date.toString().split('.')[0]
            self.data['dates'].append(datetime.strptime(date_str, "%Y-%m-%dT%H:%M:%S"))

            self.print_counter += 1


        def finish(self, finalState):
            pass

        def to_dataframe(self):
            return pd.DataFrame(self.data)

    return HandlerForDate()


## Zone of interest defined by four points

North_Point = GeodeticPoint(FastMath.toRadians(43.88794), FastMath.toRadians(3.636), 0.0)
West_Point = GeodeticPoint(FastMath.toRadians(42.62314), FastMath.toRadians(2.54371), 0.0)
South_Point = GeodeticPoint(FastMath.toRadians(41.74281), FastMath.toRadians(5.33159), 0.0)
East_Point = GeodeticPoint(FastMath.toRadians(43.19935), FastMath.toRadians(6.26817), 0.0)

geodeticPoints  = [North_Point,West_Point,South_Point,East_Point]
ZOI = EllipsoidTessellator.buildSimpleZone(1.0e-10,geodeticPoints)


# Orbit definition
initial_date = AbsoluteDate(2026, 1, 1, 0, 0, 0.0, TimeScalesFactory.getUTC())
Propagation_duration = 3600*4.0*24

ra = 500*1000.0  # Apogee in meters
rp = 500* 1000.0  # Perigee in meters
i = 80
omega = float(0)  # Perigee argument in radians
raan = float(0)    # Right ascension of ascending node in radians
lv = float(0)     # True anomaly in radians
a = (rp + ra + 2 * Constants.WGS84_EARTH_EQUATORIAL_RADIUS) / 2.0
e = 1.0 - (rp + Constants.WGS84_EARTH_EQUATORIAL_RADIUS) / a

mu = Constants.EGM96_EARTH_MU

initialOrbit = KeplerianOrbit(a, e, math.radians(i), math.radians(omega), math.radians(raan), math.radians(lv),
                                PositionAngleType.TRUE, FramesFactory.getEME2000(), initial_date, mu)

# Satellite definition
satellite_mass = float(20)
area = float(0.251)


GravityProvider = GravityFieldFactory.getNormalizedProvider(10, 10)
earth = OneAxisEllipsoid(Constants.WGS84_EARTH_EQUATORIAL_RADIUS,
                            Constants.WGS84_EARTH_FLATTENING,
                            FramesFactory.getITRF(IERSConventions.IERS_2010, True))

inertialFrame = FramesFactory.getEME2000()
sun = CelestialBodyFactory.getSun()
itrf = FramesFactory.getITRF(IERSConventions.IERS_2010, True)
earth = OneAxisEllipsoid(Constants.WGS84_EARTH_EQUATORIAL_RADIUS, Constants.WGS84_EARTH_FLATTENING, itrf)
dragCoef = 2.2
drag = IsotropicDrag(area, dragCoef)
strengthLevel = MarshallSolarActivityFutureEstimation.StrengthLevel.AVERAGE
supportedNames = MarshallSolarActivityFutureEstimation.DEFAULT_SUPPORTED_NAMES
inputParameters_Drag = MarshallSolarActivityFutureEstimation(supportedNames, strengthLevel)
atmosphere = NRLMSISE00(inputParameters_Drag, sun, earth)
orbitType = OrbitType.CARTESIAN
isotropicRadiationSingleCoeff = IsotropicRadiationSingleCoefficient(area, 1.8)
solarRadiationPressure = SolarRadiationPressure(sun, earth,
                                                isotropicRadiationSingleCoeff)


# Propagator Set Up
minStep = 0.00000000001
maxStep = 50.0
initStep = 60.0
positionTolerance = 1.5
tolerances = NumericalPropagator.tolerances(positionTolerance, initialOrbit,orbitType)
integrator = DormandPrince853Integrator(minStep, maxStep,
                                        JArray_double.cast_(tolerances[0]), JArray_double.cast_(tolerances[1]))

integrator.setInitialStepSize(initStep)
initialState = SpacecraftState(initialOrbit, satellite_mass)
propagator = NumericalPropagator(integrator)
propagator.setOrbitType(orbitType)
propagator.setInitialState(initialState)

# Setting a Nadir Pointing attitude
attitude = NadirPointing(initialOrbit.getFrame(), earth)
propagator.setAttitudeProvider(attitude)

# Add forces (Not really important for such small propagation duration)
propagator.addForceModel(DragForce(atmosphere, drag))
propagator.addForceModel(solarRadiationPressure)
propagator.addForceModel(HolmesFeatherstoneAttractionModel(earth.getBodyFrame(), GravityProvider))


# Camera parameters ##

half_angle_x = FastMath.toRadians(20.0)     # Horizontal half angle (dihedral 1)
half_angle_y = FastMath.toRadians(20.0)     # Vertical half angle (dihedral 2)
margin = 0.0                                # Optional margin around the field of view


center = Vector3D.PLUS_K  # Center direction (e.g., pointing along z-axis)
axis1 = Vector3D.PLUS_I   # Horizontal axis (e.g., x-axis)
axis2 = Vector3D.PLUS_J   # Vertical axis (e.g., y-axis)


# Define the field of view as a double dihedral FoV
fov = DoubleDihedraFieldOfView(center, axis1, half_angle_x, axis2, half_angle_y, margin)
targetZoneDetector = FootprintOverlapDetector(fov,  earth, ZOI, 10000.0).withHandler(ContinueOnEvent())
propagator.addEventDetector(targetZoneDetector)

# creation of a Event logger to know when the satellite enters and exits the Zone of Interest
eventsLogger_Entering_ZOI = EventsLogger()
ev_logs_Entering_ZOI = eventsLogger_Entering_ZOI.monitorDetector(targetZoneDetector)
ev_logs_Entering_ZOI = EventSlopeFilter(ev_logs_Entering_ZOI, FilterType.TRIGGER_ONLY_DECREASING_EVENTS)
propagator.addEventDetector(ev_logs_Entering_ZOI)

eventsLogger_Exiting_ZOI = EventsLogger()
ev_logs_Exiting_ZOI = eventsLogger_Exiting_ZOI.monitorDetector(targetZoneDetector)
ev_logs_Exiting_ZOI = EventSlopeFilter(ev_logs_Exiting_ZOI, FilterType.TRIGGER_ONLY_INCREASING_EVENTS)
propagator.addEventDetector(ev_logs_Exiting_ZOI)


time_step = 5.0
Handler = Handler_for_plot_Definition()
Propagator.cast_(propagator).setStepHandler(time_step,Handler)

# Propagate
final_state = propagator.propagate(initial_date, initial_date.shiftedBy(Propagation_duration))


# Print the logged events
Events_entering = eventsLogger_Entering_ZOI.getLoggedEvents()
Nb_low=Events_entering.size()
Events = {'timestamp': [], 'event': []}
for i in range (0, Nb_low):
    date = Events_entering.get(i).getState().getDate().toString()
    date = date.split('.')[0]
    time = datetime.strptime(date,"%Y-%m-%dT%H:%M:%S")
    Events['timestamp'].append(time)
    Events['event'].append(f"Entering ZOI")

Events_exiting = eventsLogger_Exiting_ZOI.getLoggedEvents()
Nb_low=Events_exiting.size()

for i in range (0, Nb_low):
    date = Events_exiting.get(i).getState().getDate().toString()
    date = date.split('.')[0]
    time = datetime.strptime(date,"%Y-%m-%dT%H:%M:%S")
    Events['timestamp'].append(time)
    Events['event'].append(f"Exiting ZOI")

df = pd.DataFrame(Events).sort_values(by=['timestamp'])
print(df)


def plot_groundtrack(handler):
    fig = go.Figure()
    hover_text = [f"Date: {date}" for date in handler['dates']]

    fig.add_trace(go.Scattergeo(
        lon=handler['longitude'],
        lat=handler['latitude'],
        mode='lines',
        line=dict(width=2, color='blue'),
        name="Groundtrack",
        text=hover_text,
        hoverinfo='text'
    ))

    # Add the ZOI
    zoi_lons = [math.degrees(p.getLongitude()) for p in [North_Point, East_Point, South_Point, West_Point]]
    zoi_lats = [math.degrees(p.getLatitude()) for p in [North_Point, East_Point, South_Point, West_Point]]
    zoi_lons.append(zoi_lons[0])
    zoi_lats.append(zoi_lats[0])

    fig.add_trace(go.Scattergeo(
        lon=zoi_lons,
        lat=zoi_lats,
        mode='lines+text',
        fill='toself',
        fillcolor='rgba(255, 105, 180, 0.3)',
        line=dict(width=1, color='pink'),
        name="Zone of Interest (ZOI)"
    ))

    fig.update_layout(
        title='Satellite Groundtrack with Zone of Interest',
        geo=dict(
            projection_type="natural earth",
            showland=True,
            landcolor="rgb(243, 243, 243)",
            countrycolor="rgb(204, 204, 204)"
        ),
        autosize=True
    )

    fig.show()

df = Handler.data
plot_groundtrack(df)
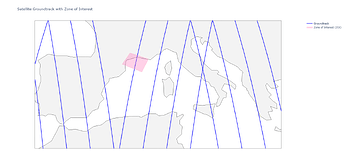
This code should lead to the following output for now :
            timestamp         event
0 2026-01-01 17:30:38  Entering ZOI
2 2026-01-01 17:32:00   Exiting ZOI
1 2026-01-02 17:08:33  Entering ZOI
3 2026-01-02 17:09:53   Exiting ZOI
and :
Be careful to change the Orekit database to yours !
Thank you for your help !
Cheers,
Emilien
