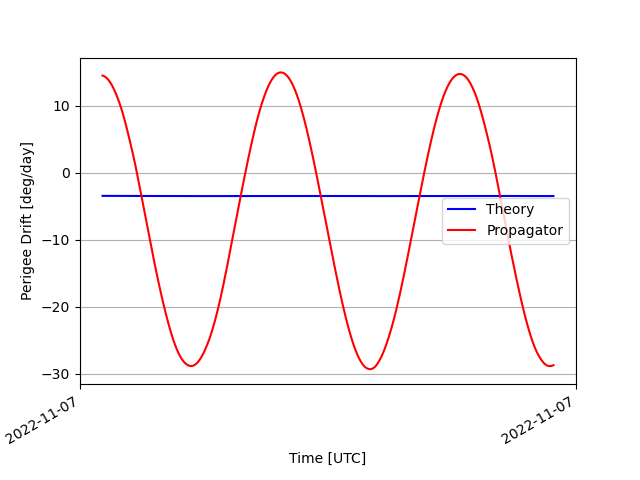
Ok, you are right. In fact I now calculated the Perigee drift as:
PerigeerArgumentDot + TrueAnomalyDot - KeplerianMeanMotion
and got a much more familiar result:
However, I am still concerned about the behavior of the Perigee and Apogee. In the following figure I plotted the altitude of my orbit (left Y axis, red) and the ApsideDetector g function (right Y axis, black):
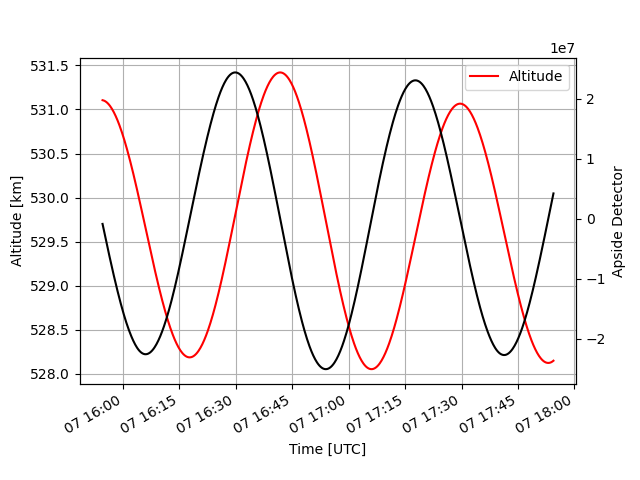
Altitude is calculated by taking the norm of the PVCoordinates Position in EME2000 and subtracting the WGS84 Earth equatorial radius.
As you may notice, the apogees and the perigees are about 45-50 minutes apart, while the KeplerianPeriod of this orbit is around 95 minutes.
I have orbit navigation measurements of real satellites in similar orbits and this behavior is not present.
Edit: let me specify that altitude trend in this short-term propagation is as expected without the Holmes-Featherstone model i.e. 95 minutes between two consecutive apogees or perigees.